Possible Climate-Change and Energy Outcomes in the Next 30 Years

In the research of the issues that will shape the future of the United States I found the energy and climate change issues were the least understood. This isn’t surprising since significant research and studies on climate change ramped up just 50 years ago. Large advances have been made in our understanding of the dynamics of the world’s ecosystem and the threats of climate change. However, it is an immense, complex task to integrate the results and findings of all the research and studies being done and educate everyone on the latest findings and implications. 

The Intergovernmental Panel on Climate Change (IPCC)—the intergovernmental body of the United Nations responsible for advancing knowledge on human-induced climate change—was organized to compile the global understanding of human-induced climate change, the natural, political, and economic impacts and risks, and possible response options. The first IPCC “Assessment Report” was published in 1990. In 2015 the IPCC began its sixth assessment cycle and published the initial results of the sixth cycle in 2021. It will complete the sixth cycle in 2023.

A key element of the IPCC assessment process and communication of findings is the application of probabilities and the language of uncertainty to summarize the findings of the thousands of scientific papers available on the various topics at a given time. IPCC reports highlight the ranges of findings and the level of consensus among the hundreds of papers on every topic. Those probabilities and degrees of consensus provide an easy-to-appreciate sense of the research communities’ knowledge of topics and best guesses about the future. While there are criticisms of the reports from all sides, the IPCC organization has done an astonishing job to date capturing the world’s knowledge on climate change every 6 years, showing how that knowledge has changed over the years (since 1990), and presenting the results to the world.

Now that the research and analysis effort is well underway, perhaps the largest challenge the IPCC faces is effective dissemination of the assessment results to update the world on the revised understanding of climate change and its effects. Few outside the scientific community read the reports or the summaries. Most of the world’s population gets their information on the latest IPCC findings from the media. However, the IPCC news is generally lost amongst all the other news about climate change and energy.

This is a significant problem because households, city councils, businesses, and government agencies are making decisions all the time where knowledge and understanding about climate change and energy use are essential. It’s a muddle: No one in the room is ever on the same page, even on the basics. As the knowledge continues to change significantly every six to seven years, this dissemination of results will be a problem.

Everyone needs to learn and believe that IPCC findings should be the basis for decision making. Before a household, city council, business, or government agency decides anything where climate change and energy use are issue, they should ask, “What do we know from the latest IPCC assessment?” Attempting to reason about the implications of climate change and energy use at any level—local, regional, or global—without understanding the latest basic IPCC assessment findings is like driving at night without headlights. IPCC summaries are large, but anyone can learn the basics of what the world “knows” (and doesn’t know), what’s generally predictable in the next thirty years and what’s not.

In the development of the three US scenarios from 2022 to 2050 climate change and energy issues were inseparable. I relied on the IPCC assessment reports, particularly the Sixth Assessment findings released in 2021, the Fifth Assessment cycle reports completed in 2014, and Fourth Assessment cycle reports completed in 2007, on climate change issues. For energy issues, I primarily relied on US Department of Energy projections, International Energy Agency reports, BP Statistical Review of World Energy 2020, and Royal Dutch Shell scenario reports to identify the major drivers. 

I divided the combined group of climate change and energy issues into two categories: those with uncertain outcomes over the next thirty years and those with “more predictable” outcomes. This judgment about what can and can’t be predicted in next thirty years is a key factor in any decision about what to do, and when to do it. In the next section I will provide details on the predictable outcomes of the future for climate change and energy that every decision needs to account for. In the section after that, I will lay out possible differences of climate-change and energy outcomes that could emerge from the different dynamics of the three US scenarios.

Predictable Climate-Change and Energy Outcomes, 2022 to 2050

The predictable developments are the foundation and assumptions of the future for the three scenarios.

Understanding of climate change to date. The global understanding of human-induced climate change, the natural, political, and economic impacts and risks, and possible response options continues to advance. The Intergovernmental Panel on Climate Change (IPCC)—the intergovernmental body of the United Nations responsible for advancing knowledge on human-induced climate change—continues to conduct periodic, systematic reviews of all relevant published literature and compile key findings into “Assessment Reports” for policymakers and the public. The scientific community, non-governmental organizations, media, country policymakers, and the public increasingly rely on this “biggest peer review process in the scientific community.”

Atmospheric temperature changes. The IPCC report published in August 2021 had a new important conclusion: the earth is warming.  According to the IPCC report global surface temperature was 1.1 °C higher in 2011– 2020 than 1850–1900, with larger increases over land (1.6 °C) than over the ocean (0.9 °C). The report also contained smaller ranges of its global surface temperature projections in the future. By 2050, compared to 1850–1900, global surface temperature is projected to be between 1.6°C and 2.1°C.

Climate-change effects—global: rain, storms, droughts, wildfires, and flooding. According to the latest IPCC reports, because the earth is approximately 1˚C warmer, we are seeing the effects of that warming in the recent temperature extremes, drought conditions and storms around the world. The IPCC report indicates the temperature extremes, drought conditions and storms around the world are likely to get incrementally worse over the next 30 to 80 years.

The average annual global land precipitation is projected to increase by 0–10% by 2081–2100 relative to 1995-2014. Precipitation is projected to increase over high latitudes, the equatorial Pacific and parts of the monsoon regions, but decrease over parts of the subtropics and limited areas in the tropics. The increased atmospheric temperature will lead to an earlier onset of spring snowmelt, with higher peak flows at the expense of summer flows in snow-dominated regions globally.

The warmer climate will intensify very wet and very dry weather and climate events and seasons, with implications for flooding or drought and it is likely that rainfall variability related to the El Niño–Southern Oscillation will be amplified by the second half of the 21st century. Each additional 0.5°C of global warming will cause clearly discernible increases in the intensity and frequency of hot extremes, including heatwaves, heavy precipitation, agricultural and ecological droughts, as well as reductions in Arctic sea-ice, snow cover and permafrost. There will be an increasing occurrence of some extreme events unprecedented in the observational record with additional global warming, even at 1.5°C of global warming.

The IPCC report concluded global mean sea level increased by 0.15 to 0.25 m between 1901 and 2018. By 2050, the increase in global mean sea level will be 0.30 to 0.45 m higher than it was in 1901.

Climate-change effects, United States: rain, storms and flooding, droughts, and wildfires. The western, central, and eastern regions of the United States will experience higher warming levels like the rest of the globe. Central and western United States will have increases in drought and fire weather. 

The 2021 IPCC report said, “. . . as global temperatures rise . . . [in the United States] precipitation and surface water flows [are] projected to become more variable over most land regions within seasons, and from year to year.”

The average amount of precipitation per year in all three regions of the United States—western, central, and eastern—will remain at least the same, even in the western part. There’s a good chance the eastern part of the United States will see higher averages; there is some chance the western and central regions will have higher averages.

There will be, in the words of the IPCC, “clearly discernible increases in the intensity and frequency of hot extremes, including heatwaves, heavy precipitation, agricultural and ecological droughts, as well as reductions in Arctic sea-ice, snow cover and permafrost [in and around Alaska].”

Technology to limit GHGs emissions or remove GHGs from atmosphere. Large scale projects in afforestation (planting trees) and direct carbon capture systems won’t have a significant impact on greenhouse gas levels in the atmosphere before 2050 because the technologies can’t be commercialized and implemented in time. It’s uncertain, but plausible that some technologies could have a large impact on GHGs in the atmosphere from in the period from 2050 to 2100.

Energy consumption in emerging economies. Emerging economies, including China and India, accounted for approximately 60 percent of the world’s energy consumption in 2020. This will increase to approximately 70 percent in 2050.

World energy intensity. The GDP growth of non-OECD countries from 2020 to 2050 will drive down global energy intensity by 40 to 50 percent. Energy intensity is the measure of how much energy is required for each unit of GDP. In 2015, energy intensity was 4.5 MJ per US$ of GDP. In a market economy, competitive pressures result in energy efficiencies, lower energy costs, and lower energy intensity. When the global economy is growing, energy intensity drops approximately 2 percent per year. 

China’s installed hydrocarbon capacity to generate electricity. Installed hydrocarbon capacity used to general electricity (mix of natural gas and coal) will grow from 4600 gigawatts capacity in 2019 to about 5200 GW in 2050.

Summaries of the three US 2050 Scenarios

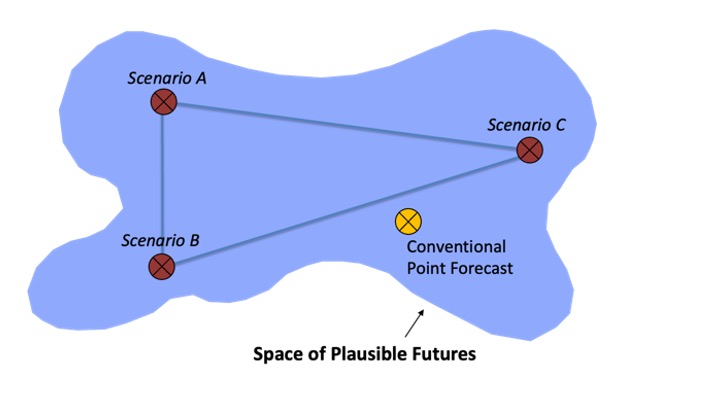
The three scenarios of the United States’ future from 2022 to 2050 were created to explore possible outcomes and interactions of four overarching uncertainties: (1) the role of the US government in society, (2) the strength of the US economy, (3) China’s strategy in the struggle against the U.S. to shape world order, and (4) global energy use and greenhouse-gas (GHG) emissions.

Socially Divided. The development that defines Socially Divided is China’s brutal nationalism and displacement of the United States as the world’s number one superpower. China asserts its regional dominance of Asia, and attacks and overwhelms Taiwan. U.S. society is deeply divided and control of the US federal government bounces between Democrats and Republicans. U.S. government programs are added to focus on domestic social and energy/climate problems and U.S. federal government spending expands from 21% of GDP in 2019 to 30% in 2050. Global economic growth is modest from 2021 to 2050; rates for the U.S. and China are 1.3 percent/yr and 3.1 percent/yr, respectively. The world, led by China and India, develops extensive new renewable energy supplies to maintain strong global economic growth but continues to rely on large volumes of hydrocarbons through 2050. Total GHG emissions slowly decline from 55 GtCO2e/yr in 2020 to 45 GtCO2e/yr in 2050.

Security United: The signature event of the “Security United” scenario is the global depression from 2026 to 2035 brought on by China’s collapsing economy. US economic growth is weak—U.S. GDP growth averages 1.1 percent per year from 2021 to 2050—but the best in a global depression. China’s grow in the same period is 0.4 percent per year. As the world economy entered the depression, the US government focused on economic and geopolitical security issues without expanding the size of government. U.S. federal government spending still increases from 21% of GDP in 2019 to 24% in 2050. With the onset of the depression, China stepped back plans to forcefully assert sovereignty over Taiwan. The only “good” news of Security United is the world comes close to achieving its goal of “net-zero” emissions of CO2 by 2050 (from 40 GtCO2 in 2020) by slowing the demand for energy and using less hydrocarbons in energy supply.

Economy Focused: China and the U.S. remain neck and neck in the global competition for economic power from 2022 to 2050. China is passive aggressive toward the U.S., playing the long game to become the world’s economic superpower. China seeks to overwhelm Taiwan peacefully. The U.S. government focuses on security and economic issues without expanding the role and size of the U.S. government. U.S. federal government spending still increases from 21% of GDP in 2019 to 25% in 2050. U.S. GDP growth averages 2.0 percent per year from 2021 to 2050. After the Glasgow Climate Change meeting in 2021 and Russia’s invasion of Ukraine, the advanced economies accomplish an “about-face” on eliminating the use of natural gas and oil and limiting the use of nuclear energy. Greenhouse gas emissions remain high through 2050 but are beginning to decline rapidly because of advances and implementation of carbon capture and storage systems at the end of the scenario. By 2050 China’s economy is twice as large as the U.S. economy, and India’s economy is substantially larger than the U.S.’s.

Socially Divided Scenario: Climate-change and Energy Outcomes, 2022 to 2050

Greenhouse gas (GHG) emissions from 2021 to 2050, GtCO2e/yr. Total GHG emissions decline from 55 GtCO2e/yr in 2020 to 45 GtCO2e/yr in 2050. For CO2—the largest GHG—emissions decline from 40 GtCO2/yr in 2020 to 25 GtCO2/yr in 2050.

Atmospheric concentration levels of CO2, ppm (parts per million). Atmospheric concentration of CO2 rises from approximately 400 ppm in 2020 to 475 ppm in 2050. (It is projected to reach 550 ppm in 2100 and level off at 600 ppm in 2300.)

International policy efforts related to energy use and climate change. Advanced economies (led by the US and EU) and emerging economies (led by China and India) implement different strategies to fight climate change. Advanced economies strive to reduce the use of hydrocarbons as quickly as possible (net zero CO2 emissions by 2050) and scale up renewable energy sources as rapidly as possible; while emerging economies want to continue growing their economies, leveraging hydrocarbons for energy until renewable energy sources are plentiful enough and cheap enough to replace the hydrocarbons.

Advanced economies implement carbon pricing systems and new regulations designed to accelerate the transition away from hydrocarbons. The advanced economies also subsidize significant investments in renewable energy technologies to generate the electricity.

The US and EU agree on a system of carbon tariffs and financial subsidies to emerging economies for green power generation projects.The BRIICS countries (Brazil, Russia, India, Indonesia, China, and South Africa), South Korea and Japan vehemently protest any carbon-sanction policy by the US and EU.

China and India stop providing data on their energy use, GHG emissions, country climate conditions.

Despite the many problems, emerging economies led by China succeed in making large investments in wind, solar, and nuclear.

Government budgets for large-scale climate-change adaptation and mitigation measures worldwide. Advanced economies invest in initiatives to eliminate hydrocarbons as a source of energy, accelerate the development of renewable energy sources, and develop afforestation to pull CO2 from the atmosphere.

Government funding for mitigation projects in advanced economies quickly ramps up to on average 2 percent of GDP per year. In the United States this spending is around $400 billion/year.

Emerging economies focus their climate-change mitigation investments on building renewable energy sources. China’s average spending on climate-change mitigation is 1 percent of GDP/yr, most of it focused on the development of renewable energy, battery, nuclear energy, and carbon capture systems. In most emerging economies government spending on mitigation projects (mostly the electrification of their economies) is less than 0.25 percent of GDP/yr.

Large scale projects in afforestation (planting trees) result in a total of 5 GtCO2 in 2050 compared to zero GtCO2 being captured in 2020. Large-scale direct carbon capture systems aren’t implemented before 2050.

China government policies implemented to mitigate and adapt to climate change. China continues to rely on hydrocarbons for economic growth and refuses to limit their use.

In the early 2020s China accuses the United States of attempting to sabotage China’s, India’s, and African economic growth prospects by its promotion of global sanctions to limit the use of oil and coal.

China makes heavy investments in nuclear energy, solar and wind energy, and battery technology and develops monopolistic positions in many critical materials required for clean energy.

US federal policies enacted: Energy and climate change. The US implements new policies and regulations to mitigate climate change by eliminating US greenhouse gas emissions. The effort is two-pronged: 1) eliminate the use of hydrocarbons in the economy and 2) stimulate development of renewable energy sources and electrification of the economy. 

Emergency spending measures are required almost every year at the federal level to assist the nation in dealing with extreme weather events: floods, droughts, wildfires, freezes. State emergency response agencies are often overwhelmed.

Congressional Budget Office (CBO) estimates United States spending on mitigation is around 2 percent of GDP ($400 billion/year) and adaptation spending in the US averages about 1 percent of GDP per year ($200 billion).

The US and EU agree on a system of carbon tariffs, despite vehement objections by China, India, and the rest of the emerging economies. The US and EU also agree on a system of financial subsidies to emerging economies for green power generation projects.

World energy consumption, EJ/yr. World energy consumption increases to 725 EJ/yr in 2050 from 570 EJ/yr in 2020.

  Year 2020Year 2050
Oil172130
Natural Gas135170
Coal151100
Nuclear2950
Hydro1840
Bio5660
Solar and Wind9175
Total 570 725 
Developed Economies235210
US9580
EU7060
Emerging Economies335515
China140155
India3680
Consumption–Primary energy by fuel in exajoules of energy (EJ)

Advanced economies led by the US continue to implement policies to dramatically reduce their use of hydrocarbons by 2050 and meet future energy requirements largely with wind and solar. 

The electrification of power generation worldwide is enabled by enormous investments in China and India in nuclear energy, solar and wind energy, and battery technology. However, the electrification of the world’s economy is expensive, and not smooth. Power outages are frequent.

Hydrocarbon energy costs fluctuate wildly from year to year, and China, India and South Africa have significant energy-security problems.  China and India reject calls to slow their economies by reducing their use of hydrocarbons.

Average household energy bills in emerging market and developing economies increase by 50 percent in real terms from 2021 to 2050; in advanced economies average household bills stay level in real terms from 2021 to 2050.

Energy required to generate electricity. The percentage of final energy used to generate electricity around the world rises from 20 percent in 2019 to 40 percent in 2050.

Wind and solar generation capacity, GW. Wind and solar-electricity generation capacity increases from 880 GW in 2019 to 16,000 GW in 2050.

Coal consumption in world (EJ/yr). Coal consumption around the world declines only from 151 EJ/yr in 2020 to 100 EJ/yr in 2050, representing 14 percent of total world final energy consumption.

Passenger vehicle energy consumption (hydrocarbons v. electricity). Cars and small trucks’ consumption of energy declines from 56 EJ/yr (53 EJ/yr gasoline, 1 EJ/yr electric) in 2019 to 49 EJ/yr (28 EJ/yr gasoline, 20 EJ/yr electric) in 2050.

Security United Scenario: Climate-change and Energy Outcomes, 2022 to 2050

Greenhouse gas (GHG) emissions from 2021 to 2050, GtCO2e/yr. Total GHG emissions decline from 55 GtCO2e/yr in 2020 to 20 GtCO2e/yr in 2050. For CO2—the largest GHG—emissions decline from 40 GtCO2/yr in 2020 to 5 GtCO2/yr in 2050.

Atmospheric concentration levels of CO2, ppm (parts per million). Atmospheric concentration of CO2 rises from approximately 400 ppm in 2020 to 450 ppm in 2050. (It is projected to reach 500 ppm in 2100 and fall to 400 ppm in 2300.)

International policy efforts related to energy use and climate change. Advanced economies attempt to regulate out use of hydrocarbons in their economies and invest heavily in renewable energy technologies to generate the electricity to replace the hydrocarbon fuels. Many countries implement forms of carbon taxes, carbon tariffs, and green offsets to shape the behavior and investments of businesses and consumers and government policies around the world. 

Emerging economies struggle with energy security and resist efforts by the advanced economies to limit their use of hydrocarbons. China, India, and South Africa, refuse to limit the use of coal or natural gas in electricity generation and protest the carbon tariffs. China and India stop providing data on their energy use, GHG emissions, country climate conditions.

UN climate conferences become contentious affairs between emerging and advanced economies. Few countries meet their commitments.  

After the global depression hits in 2026, governments generally abandon carbon taxes and hydrocarbon restrictions. GHG gas emissions are going down “fast enough” due to the depression.

Government budgets for large-scale climate-change adaptation and mitigation measures worldwide. Government investment focus worldwide is on mitigation—eliminating hydrocarbons as a source of energy and accelerating the development of renewable energy sources. 

Spending by governments in advanced economies on mitigation projects vary from 0.5 percent of GDP/yr to 1.5 percent of GDP/yr. 

The emerging economies generally ignore efforts by the advanced economies to reduce the emerging economies’ use of hydrocarbons.

In the advanced economies and China and India, energy costs increase significantly because of expensive investments to electrify their economies. As a rule, the investment costs are much higher than expected while the mitigation benefits (lower energy prices) rarely materialize. Renewable energy capacity climbs slowly and hydrocarbons remain a key element of each country’s energy security.

Large-scale projects to pull CO2 from the atmosphere, by either planting millions of trees or capturing the CO2 emissions in using hydrocarbons for energy, aren’t implemented because of their infeasibility.

Despite the focus on mitigation, adaptation spending increases around the world on emergency response for extreme climate events and new civil infrastructure. It’s hard to quantify but adaptation spending averages about 1 percent of GDP per year in advanced economies and China, and 0.5 percent of GDP per year in emerging economies.

China government policies implemented to mitigate and adapt to climate change. China continues to invest heavily in renewable energy industries and electric cars.

However, it doesn’t try to curtail its use of hydrocarbons in the economy and accuses the United States of attempting to sabotage its economy and insisted the United States stop meddling in the energy strategies of emerging economies.  

China declares the United States is using its military presence in the South China Sea to limit the development and flow of oil, gas, and coal resources throughout Asia and must leave.

As the world depression unfolds beginning in 2025, China’s GHG emissions decline rapidly.

US federal policies enacted: Energy and climate change. Federal government policy is largely focused on mitigation, i.e., eliminating hydrocarbons as a source of energy and accelerating the development of renewable energy sources. 

The US and EU push for an international system of carbon tariffs on trade but they fail because of fierce objections by the developing economies, particularly China and India.

CBO estimates federal spending on mitigation at 1.25 percent per year ($250 billion/yr).

After the global depression hits in 2026, the US reverses its efforts to limit natural gas usage. It is now an important transition fuel.

Despite the focus on mitigation, US spending on emergency responses to extreme climate events and new civil infrastructure increases. US spending is estimated at about 1 percent of GDP per year. However, the states and federal government struggle to coordinate their emergency responses and political crises topple many elected officials.

World energy consumption, EJ/yr. World energy consumption decreases to 480 EJ/yr in 2050 from 570 EJ/yr in 2020.

 Year 2020Year 2050
Oil172100
Natural Gas135100
Coal15180
Nuclear2940
Hydro1830
Bio5640
Solar and Wind990
 Total570 480 
Developed Economies235170
US9570
EU7055
Emerging Economies335310
China140120
India3670
Consumption–Primary energy by fuel in exajoules of energy (EJ)

In the 2020s many advanced economies implemented policies to limit future use of coal, natural gas and oil. However, renewable-energy generation and transmission-line capacity failed to materialize quickly, and the advanced economies continue to rely on hydrocarbons. Power outages are a frequent occurrence in many countries beginning in the mid-2020s.

The world energy situation dramatically improves when the global economy turns negative in 2026 and demand for hydrocarbon falls. 

Prices for oil, natural gas, and coal remain volatile, even during the depression, and energy-security issues challenge country leaders.

Average household energy bills in emerging market and developing economies double in real terms from 2021 to 2025 and remain there on average through to 2050; in advanced economies average household bills increase 25 percent in real terms from 2021 to 2025 and then decrease by a third in real terms from 2026 to 2050.

Consumer and business protests over energy bills are extreme everywhere. Many governments reverse their policies toward hydrocarbons.

Energy required to generate electricity. The percentage of final energy used to generate electricity around the world rises from 20 percent in 2019 to 40 percent in 2050.

Wind and solar generation capacity, GW. Wind and solar-electricity generation capacity increases from 880 GW in 2019 to 8,000 GW in 2050.

Coal consumption in world (EJ/yr). Coal consumption around the world declines significantly from 151 EJ/yr in 2020 to 80 EJ/yr in 2050, representing 17 percent of total world final energy consumption.

Passenger vehicle energy consumption (hydrocarbons v. electricity). Passenger vehicles consumption of energy declines from 56 EJ/yr (53 EJ/yr gasoline, 1 EJ/yr electric) in 2019 to 45 EJ/yr (35 EJ/yr gasoline, 10 EJ/yr electric) in 2050.

Economy Focused Scenario: Climate-change and Energy Outcomes, 2022 to 2050

Greenhouse gas (GHG) emissions from 2021 to 2050, GtCO2e/yr. Total GHG emissions rise from 55 GtCO2e/yr in 2020 to 60 GtCO2e/yr in 2030 before falling back to 55 GtCO2e/yr in 2050.  CO2 emissions decline from 40 GtCO2/yr in 2020 to 39 GtCO2/yr in 2050.

Atmospheric concentration levels of CO2, ppm (parts per million). Atmospheric concentration of CO2 rises from approximately 400 ppm in 2020 to 500 ppm in 2050. (It is projected to level off at 600 ppm in 2100 and remain at that level until 2300.)

International policy efforts related to energy use and climate change. Working through UN climate conferences, countries pursue individual national strategies for energy security, protecting themselves from the effects of climate change, reducing GHG emissions, making their countries more economically and physically resilient. For most, the priorities to 2050 are to diversify energy sources (but not to eliminate hydrocarbon usage) and protect themselves (modify civil and social infrastructure) for the anticipated effects of climate-change in the next thirty years and beyond.

China and India discourage but don’t limit the use of coal. Heavy investments are made in large-scale wind, solar, and new nuclear systems to meet energy demand needs and improve energy efficiencies, and in large-scale carbon-capture systems.

Many countries successfully implement forms of carbon taxes to shape the behavior and investments of businesses and consumers.

Government budgets for large-scale climate-change adaptation and mitigation measures worldwide. Government climate-change investments are focused on ameliorating the climate-change effects already being experienced.  They include increased emergency response spending for extreme climate events and capital for new civil infrastructure for the changing environment. It’s hard to quantify but adaptation spending averages about 1.5 percent of GDP per year in advanced economies and China, and 1.0 percent of GDP per year in emerging economies.

Government monies for mitigation are limited to R&D in renewable energy, next generation of nuclear energy technologies, and large-scale carbon capture systems. In advanced economies, China and India, total government mitigation investments are on the order of 0.25 percent of GDP/yr. In the US, they are 0.5 percent per year.

Large scale efforts in afforestation (planting trees) don’t take off, but direct carbon capture systems are commercialized in the early 2040s. The result is by 2050 4 GtCO2/yr being are being removed and this amount is increasing rapidly.

The crises from droughts, floods, wildfires, and food supply issues are getting worse but the world is adapting to the changed environmental conditions.

China government policies implemented to mitigate and adapt to climate change. China pushes back against foreign efforts to curtail China’s use of hydrocarbons.

China’s climate-change investments are largely aimed at mitigating the effects of natural disasters caused by the increased atmospheric temperatures and building market-leading positions in solar renewable energy systems, electric vehicles, batteries, and nuclear power generation.

US federal policies enacted: Energy and climate change. Supported by both the Republicans and Democrats, the US energy/climate change policy is to encourage diversity of energy supply, accept long-term use of natural gas as a transition fuel, re-energize nuclear power, and, of course, expedite approvals of new renewable-energy installations. While private investments flow into increasing US electricity generation capacity, government monies focus on reducing the effects of heat waves, droughts, river flooding, and wildfires. In the western United States, federal government and state governments overhaul land-use and water-rights laws and regulations.

The US implements a carbon tax in the US to shape the behavior and investments of businesses and consumers. A global system for carbon tariffs is also implemented after the EU, China, India, and US agree to support a system and the WTO adjusts its rules to enable carbon tariffs in trade agreements.

Federal government investments are focused on ameliorating the climate-change effects already being experienced.  They include increased emergency response spending for extreme climate events and capital for new civil infrastructure for the changing environment. It’s hard to quantify but adaptation spending averages about 1.5 percent of GDP per year.

Government monies for mitigation are limited to R&D in renewable energy, next generation of nuclear energy technologies, and large-scale carbon capture systems. In the US, spending on mitigation is 0.5 percent of GDP per year.

World energy consumption, EJ/yr. World energy consumption increases to 845 EJ/yr in 2050 from 570 EJ/yr in 2020.

 Year 2020Year 2050
Oil172150
Natural Gas135170
Coal15180
Nuclear29115
Hydro1860
Bio5690
Solar and Wind9180
 Total 570 845
Developed Economies235210
US95100
EU7060
Emerging Economies335635
China140155
India3690
Consumption–Primary energy by fuel in exajoules of energy (EJ)

Following the Glasgow Climate Change meeting in 2021, the advanced economies accomplish an “about-face” on eliminating the use of natural gas, oil and nuclear. Natural gas and oil are viewed as critical to a successful transition of the world’s economy to electrification by the end of the century. Their policy priorities are: nuclear and hydrogen energy generation, renewable energy. energy-storage systems, technologies to adapt society to climate-change effects, and technology development of carbon-capture systems.

The use of hydrocarbons finances the transition to clean energy sources. Carbon taxes and tariffs are slowly but steadily increased.

Average household energy bills in emerging market and developing economies increase by 75 percent in real terms from 2021 to 2025; in advanced economies average household bills decline by 30 percent in real terms from 2021 to 2050.

Energy required to generate electricity. The percentage of final energy used to generate electricity around the world rises from 20 percent in 2019 to 34 percent in 2050.

Wind and solar generation capacity, GW. Wind and solar-electricity generation capacity increases from 880 GW in 2019 to 12,000 GW in 2050.

Coal consumption in world (EJ/yr). Coal consumption around the world declines from 151 EJ/yr in 2020 to 80 EJ/yr in 2050, representing 9 percent of total world final energy consumption.

Passenger vehicle energy consumption (hydrocarbons v. electricity). Passenger vehicles consumption of energy increases from 56 EJ/yr (53 EJ/yr gasoline, 1 EJ/yr electric) in 2019 to 92 EJ/yr (72 EJ/yr gasoline, 16 EJ/yr electric) in 2050.

Predictable Developments of the United States’ Future—2022 to 2050

I developed three scenarios of the United States’ future from 2022 to 2050 to make sense of the major issues facing US society. Those scenarios and the process used to create them were described in an article “Three Scenarios of the United States’ Future – 2022 to 2050,” published in the management journal Strategy & Leadership, Vol. 50, No. 6, in November 2022.

Issues with the widest ranges of plausible outcomes in the next three decades—according to the issue experts—were used to craft the three scenarios—Socially Divided, Security United, and Economy Focused—while the major issues with narrower ranges of plausible outcomes, where experts were in relative agreement on long-term outcomes, turned into the common assumptions and backdrop of the three scenarios. This second group of pressing issues are the predictable developments of the United States’ future.

The Predictable Part of the United States’ Future

The relatively predictable issues are important because they can’t be avoided. We must plan for them, regardless of how the more uncertain issues play out. Some large-impact, predictable issues were obvious from the start, like population growth, because demographic trends of the past often suggest reasonably certain outcomes in the future. However, for many issues the experts’ agreements on future outcomes couldn’t be identified until the experts’ views of possible outcomes had been examined and judged to fall within narrow ranges. For example, there are critical issues in the areas of climate-change, China’s government leadership, and US population attitudes, where experts generally agree on the outcomes thirty years from now. 

Projected Global Population

 20202050Growth/yr
Asia4.64 billion5.29 billion0.5 %
Africa1.342.492.1
Europe0.750.71(0.1)
North America0.370.430.5
World7.799.740.8

Russia invasion of Ukraine

Russia’s invasion of Ukraine will end in 2023 with a cease-fire and Russia occupying much of the southeastern part of Ukraine. The US and EU countries implement economic sanctions to “silo” Russia from Europe except for essential energy, minerals, and food flows.

Key assumptions about U.S. society

The US population, regardless of their racial, ethnic, or social makeup, will continue to share three priorities for the federal government: Improve the economy and job situation, manage public crises (pandemics, natural disasters, etc.), and ensure the population’s security and safety (military attacks, terrorism, domestic crime, corruption, etc.).

The Democratic and Republican parties will adjust their policy platforms and communication strategies to attract voters, and the U.S. population will split their voting for candidates between the two parties.

Because of an aging population, total public benefits to the U.S. population aged 60 and over are expected to reach approximately 20 percent of annual GDP in 2050 from 12 percent in 2010. For comparison purposes, in Germany total public benefits to its population 60 and over is expected to grow from 17 percent in 2010 to 25 percent in 2050.

US K–12 students will continue to test average or just below average in literacy, math and science compared to other OECD countries. A substantial percent of US 15-year-olds (10 to 15 percent) will continue to lack the skills to read, master basic math, and understand scientific concepts. For comparison purposes, in 2015 13% of all students in OECD countries lacked the same rudimentary reading, math, and science skills.

China developments

The Chinese Communist Party (CCP) will remain in power and direct China’s economic and foreign policies for the foreseeable future. CCP representatives will continue to occupy senior positions in every medium- to large- Chinese company to ensure the strategies and actions of Chinese state-owned and private companies align with and support government policies.

China will remain focused on regaining its position at the top of the Asia hierarchy and supplanting the U.S. as the world’s dominant superpower. 

China will continue to refine the country’s economic statist model of state capitalism, intervention in markets, regulation of private-sector activities, and subsidization of Chinese companies, goods and services, and the stealing of foreign intellectual property and data.

China will have the world’s largest economy in 2050. In 2021 China’s economy was essentially the same size as the US’s economy. In the two common methods of cross-country comparison of economic size—the Nominal GDP method and the purchasing power parity (PPP) method—the US economy was 36 percent larger than China’s economy using the Nominal GDP method (the Nominal GDP of the United States in 2021 was $22.9 trillion and China’s Nominal GDP was $16.9 trillion, while China’s economy was about 18 percent larger than the US’s GDP in PPP$ (China’s GDP in PPP$ in 2021 was $26.7 trillion and the US’s GDP in PPP$ was $22.7 trillion in 2021). China’s economy in Nominal GDP is expected to surpass the US’s Nominal GDP in the next ten years. 

China will struggle to maintain high-economic growth rates in the future because China’s work force will shrink by 15 to 20 percent from 2021 to 2050, or about 150 million workers. While the world’s population will continue to grow at about 1 percent per year, reaching 9.7 billion people in 2050, China with about 1.4 billion, will shrink in population by almost 1 percent per year. 

Foreseeable use of coal, oil and natural gas

To fuel economic growth, emerging economies will require 60–70 percent of the world’s energy from 2020 to 2050, with China accounting for around 20 percent of the world’s total and India over 10 percent.

Competitive pressures in energy markets will result in technological innovation, energy efficiencies, lower energy costs, and lower energy intensity. GDP growth of emerging economies from 2020 to 2050 will drive down global energy intensity by 40 to 50 percent.

The consumption of hydrocarbons will decline worldwide from 80 percent of all energy consumed in 2018 to at best 40 percent of energy consumed in 2050.

Unavoidable climate-change developments

According to the UN’s Intergovernmental Panel on Climate Change (IPCC) Sixth Assessment reports published in 2021 and 2022, the world has warmed by 2ºF/1.1ºC since the second half of the 19th century because of greenhouse gas emissions and will increase by another 0.9°F/0.5°C to 1.8°F/1.0°C by 2050.

Because the earth is 2°F warmer today, the world is experiencing temperature extremes, heavier periods of precipitation, and more drought conditions. 

As the globe gets incrementally warmer over the next 30 years, what we are experiencing today will become incrementally but not catastrophically worse.

In the US, the IPCC projects overall precipitation on average will be the same or greater compared to the last 150 years, even in the southwestern states. However, the variability in precipitation from year to year will be greater and for many parts of the US the droughts will be greater.

Large scale projects in afforestation (planting trees) and direct carbon capture systems won’t have a significant impact on greenhouse gas levels in the atmosphere before 2050 because the technologies can’t be commercialized and implemented in time.

Expected global health developments

As a result of the world’s economic growth and increased life expectancies over the last fifty years, there will be increased spending on health care. No nation will be spared. 

There will be more health epidemics. However, the experience of battling Covid19 over the last three years will lead to better responses and societies won’t be as disrupted as they were from 2020 – 2022. 

Nuclear weapon proliferation

Iran joins the nuclear-weapon club, and so does Japan after North Korean provocations.

Digital data assumption

Digital data volumes will grow at Moore’s-Law-like rates for the next 30 years—on the order of 25% per year.

Next Step: Think about the Implications of the Predictable Developments

Before preparing for the future as represented by the three scenarios—Socially Divided, Security Oriented and Economy Focused—think about all the above predictable developments together and ask yourself, “What will be the threats and opportunities I will face with these developments?” And, “What should I do, starting today, to minimize the threats and take advantage of the opportunities?

Announcing Three Scenarios of the United States’ Future — 2022 to 2050

We all worry about the perils of an uncertain future, and what we can do in anticipation of it. Top of mind worries include how the pandemic could play out, the competition for power between the Democratic and Republican parties in the United States, Russia’s invasion of Ukraine, China’s belligerence toward the United States, climate change threats, the future dynamism of the U.S. economy and the increasing effects of digital data on every dimension of society. 

To address my worries about the future, I created three scenarios for how the United States could change over the next twenty-eight years focusing on the major issues with the widest ranges of possible outcomes. Together, the three scenarios provide a framework for anticipating the future. If all the futures for the United States were represented as points in a two-dimensional figure (below), there are infinite possibilities. If the points near the edge of the figure represent extreme plausible scenarios, then I can approximate or blanket the possible futures for my anxiety issues by selecting three points — i.e., scenarios — at the edge.

In the middle of 2022 I completed development of the scenarios. The article “Three Scenarios of the United States’ Future – 2022 to 2050” was published in the management journal Strategy & Leadership, Vol. 50, No. 6, in November 2022.

Over the coming weeks I will present the three scenarios, discuss the major forces and dynamics, and highlight implications. In this blog I introduce the scenarios.

Identifying the Issues to Focus on

To identify the dominant issues that will shape the United States, I reviewed what experts were saying would be the forces and dynamics that will shape the United States’ future out to 2050. From this set of high-impact issues, I pinpointed those where experts were projecting the widest ranges of possible outcomes in thirty years. This group of high-impact, high-uncertainty issues would be the focus of the scenarios.

Note: The dominant issues with narrower ranges of possible outcomes in 2050 weren’t discarded but included as the common backdrop for the scenarios.

The high-impact, high-uncertainty issues included a mix of demographic, environmental, social, economic, political, and geopolitical forces and drivers, and based on their influence on each other, the issues clustered into four central scenario dynamics. Two extreme outcomes, representing the range of expert opinions of possible outcomes in thirty years, were determined.

  • How will the role of the US government evolve over the next 28 years? At one extreme, the U.S. government expands its role in society by enacting big programs that focus on domestic social and energy/climate problems. U.S. federal government spending expands from 21% of GDP in 2019 to 30% in 2050. At the other extreme, the U.S. government focuses on security and economic issues without expanding the role and size of the U.S. government. U.S. federal government spending still expands from 21% of GDP in 2019 to 25% in 2050.
  • How strong will be the US economy over the next thirty years? At one extreme, U.S. GDP growth averages 1.0 percent per year from 2021 to 2050. At the other extreme, U.S. GDP growth averages 2.0 percent per year from 2021 to 2050.
  • What will be China’s strategy in the struggle against the U.S. to shape the international order? At one extreme, China aggressively confronts the U.S. position in Asia. China moves to assert sovereignty over Taiwan, dominate the Asia region, and remain the center of global trade. At the other extreme, China is passively aggressive toward the U.S., playing the long game to become the world’s economic superpower and refraining from provoking the U.S. China seeks to overwhelm Taiwan peacefully.
  • What will be global energy use and greenhouse-gas (GHG) emissions from 2021 to 2050? At one extreme, the world achieves its goal of “net-zero” emissions of CO2 by 2050 (from 40 GtCO2 in 2020) by slowing the demand for energy and using less hydrocarbons in energy supply. At the other extreme, the world develops extensive new renewable energy supplies to maintain strong global economic growth but continues to rely on large volumes of hydrocarbons through 2050. CO2 emissions in 2050 are the same as they were in 2020: 40 GtCO2.

Presenting the Three Scenarios

A scenario is the integration of outcomes for the four central dynamics by a plausible narrative. Three scenarios were selected to span the possible outcomes of the four dynamics for the United States. Each dynamic extreme is represented in at least one scenario.


Three Scenario Logics of the United States’ Future — 2022 to 2050


Dynamic
:
Scenario A
“Socially Divided”
Scenario B
“Security United”
Scenario C
“Economy Focused”
US Gov’t RoleExpandedLimited Limited 
US EconomyMedium growthWeak growthStrong growth
China toward USAggressiveAggressivePassive Aggressive
Energy UseHigh consumption of hydrocarbons Low consumption of hydrocarbonsHigh consumption of hydrocarbons

The following scenario narratives are three coherent yet very different pictures of the future.

Scenario A: “Socially Divided”

The development that defines the “Socially Divided” scenario is China’s brutal nationalism and displacement of the United States as the world’s number one superpower. China’s leaders leverage the strengths of China’s controlled economy to displace the U.S. in political and cultural influence and economic connections in Asia, Africa, and Latin America. 

In 2024 China’s government shows its new power position in Asia by invading Taiwan, with Taiwan quickly surrendering.

China’s takeover of Taiwan creates a split between the China-led economic sphere and the U.S.-led sphere as the U.S. and its allies attempt to punish it with economic and trade sanctions. 

U.S. society is deeply divided on social and political issues, and the world watches as the government stumbles from crisis to crisis. Democrats and Republicans remain far apart in their views of government’s priorities, and political compromises are rarely reached. Control of the U.S. federal government bounces between the Democrats and Republicans, and the country reels from attempted policy changes when the other party gains control in Washington. The Democrats succeed in implementing laws to expedite the development of energy renewables, eliminate use of hydrocarbons, and provide more financial aid to low-income families. Neither party can develop a foreign policy strategy that is popular with the electorate. However, the electorate is clear on one foreign policy issue: no confrontation with China over Taiwan.

U.S. federal government spending increases from 21 percent of GDP in 2019 (before Covid) to 30 percent in 2050. Military spending as a percent of GDP declines from 3.2 percent of GDP in 2019 to 1.9 percent in 2050.

Global economic growth is modest from 2021 to 2050, averaging just 2.7 percent/yr. OECD countries (or advanced economies) grow 1.0 percent/yr, while non-OECD countries — the emerging economies — grow 3.5 percent/yr in the period. Rates for the U.S. and China are 1.3 percent/yr and 3.1 percent/yr, respectively.

While China has the largest economy in the world and is growing faster than the U.S., China’s economy is slowing down because of energy supply problems, government bureaucracy and corruption and a shrinking work population. Other than China, emerging economies struggle to meet the needs of their growing populations.

The electrification of power generation worldwide is enabled by enormous investments in China and India in nuclear energy, solar and wind energy, and battery technology. However, the electrification of the world’s economy is expensive, and not smooth. Power outages are frequent. Energy security and costs remain significant problems throughout the scenario.

World energy consumption increases from 570 EJ/yr in 2020 to 725 EJ/yr in 2050. China, India, and other emerging economies depend on energy from hydrocarbons to sustain their economic growth.

By 2050, the United States economy no longer outperforms other advanced economies; and the U.S. standard of living is level with the EU standard of living. Poverty levels in the country have declined but the percent of households receiving federal housing assistance has grown from about 6 percent in 2016 to 12 percent in 2050; unemployment is running high, and life expectancies in the country are below those of most EU countries.

Scenario B: “Security United”

The signature event of the “Security United” scenario is the global depression from 2026 to 2035 brought on by China’s collapsing economy. After global supply chains and energy markets were severely disrupted by the pandemic and Russia’s invasion of Ukraine, inflation rose and many advanced economies, including the U.S., began implementing protectionist policies, exacerbating economic dislocations in China and the rest of the world.

Early in the scenario the U.S. and other advanced economies implemented energy and climate-change policies to electrify the world’s energy system and decarbonize the global economy. However, the restriction of oil, gas and coal supplies was causing shortages and wildly fluctuating prices. Power outages were also becoming frequent even in the advanced economies because of insufficient investment in renewable energy and electricity-transmission-line capacities.

China reaffirmed its intention to assert sovereignty over Taiwan. In response the U.S. and western Pacific allies increased their military supplies to Taiwan, solidified economic and political treaties with each other and initiated economic sanctions against China and Chinese companies.

In the U.S., federal government spending as a percent of GDP was increasing, having increased from the pre-pandemic 21 percent of GDP in 2019 to 24 percent of GDP in 2025 because of mandatory Medicare and Social Security costs for the aging population, military priorities and new programs for low-income groups and climate-change mitigation.

In 2026 the world descended into a depression. China’s economy and India’s economy were hit hard by the depression, while the U.S. suffered the least among the major economies. From 2021 to 2050 global GDP growth averages just 0.9 percent/yr. OECD countries (or advanced economies) grow 0.7 percent/yr, while non-OECD countries (the emerging economies) grow 1.0 percent/yr in the period. Rates for the U.S. and China are 1.1 percent/yr and 0.4 percent/yr, respectively.

U.S. society quickly united on the issues of the economy, security and the China threat, and both Democrats and Republicans proposed to cut federal government spending across the board, suspend all but essential health, safety and environmental regulations on infrastructure projects, but expand payments to the unemployed. After two years of negative growth, the U.S. economy begins to recover. Total U.S. federal government spending remains at 25 percent of GDP from 2026 to 2050.

The global depression results in world energy consumption decreasing from 570 EJ/yr in 2020 to 480 EJ/yr in 2050. Because of the drop in energy consumption and capacity increases in renewable energy generation and electricity transmission, the world almost achieves its net zero CO2 emissions by 2050 goal: CO2 emissions drop from 40 GtCO2 in 2020 to 5 GtCO2 in 2050.

In 2050 the U.S. is still the number one superpower and continues to maintain a strong military presence in the western Pacific. American multinationals have decoupled their supply chains from China, and America reigns supreme in digital technology development. 

While China’s economy hasn’t kept pace with the U.S. economy, it is beginning to grow again. Amid the depression, China had affirmed the objective to unite peacefully with Taiwan. However, a new generation of China leaders is emerging that is nationalistic and bellicose.

Scenario C: “Economy Focused”

China and the U.S. remain neck and neck in the global competition for economic power throughout the “Economy Focused” scenario. In the race to develop next-generation technologies, the U.S. remains the most powerful country in the digital realm. China’s economy continues to grow despite a shrinking work force, a lack of innovation compared to dynamic American, European and Asian societies and China’s forceful use of economic-coercion tactics.

China’s leaders remain focused on expanding and strengthening China’s economic links to the rest of the world and asserting China’s dominance of Asia. China maintains its goal to integrate Taiwan peacefully.

In the 2020s Taiwan develops new strong treaties with Japan, South Korea, India and the United States and builds up its military forces. At the same time, Taiwan seeks to strengthen the island’s social and economic ties with China. Pro-China political parties on the island are growing stronger.

U.S. society unites on the priorities of the economy, energy security and national security following Russia’s attack on Ukraine. Democrats and Republicans generally agree on strengthening the global economic system, the World Trade Organization and expanding access to the U.S. market. Both also support a new energy/climate policy that would make the country resilient to the climate, economic and social threats facing the country.

The U.S. economy is dynamic and continues to grow, despite an expanding federal government budget. U.S. federal government spending increases from 21 percent of GDP in 2019 to 25 percent in 2050. Federal military spending drops as a percent of GDP from 3.2 percent of GDP in 2019 to 2.5 percent in 2050.

From 2021 to 2050 the global economy is resilient and strong. Global GDP growth averages a strong 3.8 percent /yr. OECD countries (or advanced economies) grow 1.8 percent/yr, while non-OECD countries (the emerging economies) grow 5.0 percent/yr in the period. Rates for the U.S. and China are 2.0 percent/yr and 3.8 percent/yr, respectively. 

After the Glasgow Climate Change meeting in 2021 and Russia’s invasion of Ukraine, the advanced economies accomplish an “about-face” on eliminating the use of natural gas and oil and limiting the use of nuclear energy. A global system for carbon tariffs is implemented after the EU, China, India, and U.S. agree to support a system and the WTO adjusts its rules.

Because of strong economic growth in the emerging economies, world energy consumption increases from 570 EJ/yr in 2020 to 845 EJ/yr in 2050.

Greenhouse gas emissions remain high through 2050 but are beginning to decline rapidly because of advances and implementation of carbon capture and storage systems at the end of the scenario.

By 2050 China’s economy is twice as large as the U.S. economy, and India’s economy is substantially larger than the U.S.’s. U.S. economic power is still equal to China’s because of the strength of U.S. trade relations, its superior financial system, and the leadership of U.S. multinationals in many high-tech sectors and the service industries. The U.S. leads the world in terms of household wealth. The U.S. dollar is still the dominant global currency. 

Taiwan remains independent but China has expanded its commercial and social ties in the country. Public opinion in Taiwan supports increasing the social and economic alignment of China and Taiwan.

Three Scenarios of the Pandemic’s Impact on the United States

I prepared three scenarios of how the Covid-19 crisis could impact the United States over the next 2 years. I developed them using a scenario-development methodology I used for many years in strategy development and, in a couple of cases, crisis management.
It’s not clear to anyone where this crisis is heading. It’s not clear how the health pandemic will play out over the next two years. It’s not clear how the economy will be impacted. It’s not clear how the role of government and social norms will permanently change. The experts in healthcare offer wide-ranging analyses of how the pandemic-part of the crisis could end. Economists have their wide-ranging analyses of the economic impact. Political scientists have their views of future government stability, geopolitical relations, government’s role in society, etc. Those that study social behavior at home, work, and play also see wide-ranging possibilities.
Since these dimensions of the crisis can’t be separated in reality, we need analyses of how the crisis as a whole could play out. Good decisions in the healthcare fight can’t be made without seeing the possible costs and benefits of those decisions on the economy, government, and society. Nor can good decisions be made on the economy or the stability of government without anticipating the effects in other realms.
Using recent news reports and quick analyses by experts, three crisis scenarios (or better, disaster movie scripts) for the next two years in the United States were developed. These are not the three best predictions of what might happen, but three different narratives designed to show the extremes of how the situation for the United States might play out.  Policy makers need sense of the range of plausible outcomes that their decisions might influence.
The integration of the experts’ analyses of all aspects of the crisis reveal three broad areas of uncertainty about the United States’ future. For each area of uncertainty, two extreme outcomes were identified that help show the range of possible outcomes.
What will be the outcome of the healthcare war against the coronavirus?

  • At one extreme, the virus battle is won. The US gains control over the virus’ spread through the population and is able to maintain that control until a mass-production vaccine is available.
  • At the other extreme, fierce fights against the virus rage across the United States for two years.

What will be the impact of that war on the economy?

  • At one extreme, the US enters a great depression, several business sectors are devastated, and state and local governments can’t meet demands for basic necessities. The rest of the world, including China, has it worse.
  • At the other, US state economies are resilient, and after they begin lifting the healthcare restrictions their economies begin functioning, albeit at lower levels. Global trade rebounds.

What leadership will the US government provide to achieve the best outcomes for the country?

  • At one extreme, there’s no leadership at the federal level and the United States fails to implement coherent government policies to stop the virus, restart the US economy, and guide the global economy. Hundreds of towns and cities across the country must declare bankruptcy. Civil disorder exists throughout the country. China and Russia act with impunity throughout Asia.
  • At the other extreme, the US federal government and state governments coordinate policies and actions to manage the healthcare and economic crises, while the US federal government coordinates international crisis responses. China and Russia focus on rebuilding their economies and improving geopolitical relations.

Three alternate scenarios — combining these uncertainties — describe how the crisis in the United States could play out in the extreme over the next two years in the United State. Their titles are Too Late, Resilient, and Chastened.

SCENARIO: TOO LATE

Themes of Too Late:

  • Virus battle is won. Outcome of the war against the virus is a two-year flat curve of coronavirus cases. The priority of government officials was to combat the Covid-19 virus and prevent the US healthcare system from being overwhelmed. Total US deaths at the end of 2021 exceed 180,000.
  • The US experiences an economic depression. Long lockdowns and strict preventive measures decimate the US economy. Real GDP decreases 8.3 percent in 2020 and is flat in 2021. The impact on China’s economy is bad, decreasing 7 percent in 2020, and another 2 percent in 2021.
  • No government leadership at the top. The US federal government implements a mishmash of expensive policies for the economic depression hitting the country. State and county governments differ in how they address the sudden demand for food, shelter, and healthcare. Government officials disagree on priorities for reopening and stimulating the economy. New regulations are added for worker protection. The US foreign policy is to erect trade and immigration barriers. China aggressively expands its geopolitical activities.

Three Months:  April, May, and June 2020

Testing capabilities remain limited, but drug treatments that help patients with symptoms are quickly becoming available. The lockdowns that plunged their economies into the deep freeze are lifted slowly, but major restrictions remain through June in many states. At the beginning of June, states say they have driven down the virus infection rate to well below zero. (Known as the reproduction ratio (R0).)

New deaths in states that imposed shelter-in-place measures in early March are rapidly shrinking in mid-May. At the end of June, deaths attributed to the coronavirus exceed 100,000.

Even before the lockdowns are lifted, the numbers of new homeless and families without money for food in all the major urban areas are beyond what local agencies can handle.

As states restart their economies with strict healthcare restrictions, some 40 percent of small retailers fail to open. Air travel and mass transit are severely limited. A flood of large and small companies in travel and retail declare bankruptcy. Large companies that furloughed and laid off workers begin to bring back workers slowly. There’s great uncertainty about market demand in all industries.

Global trade is down significantly. Trade flows In Q2 2020 — measured by WTO’s volume index — are off 50 percent from Q2 2019.

There are major disagreements in the US over what the government’s role and priorities should be during the recovery and what changes should be made in the US over the long term. After the sacrifices made in the lockdowns, there is despair over the hardships being faced.

Six Months: July through December 2020

Experimental vaccines begin to rollout in September 2020 for high-risk groups. Hospitals try to resume normal operations, but many have been impacted by the lockdowns and must cut costs. Gilead’s drug remdesivir shows benefits for some sick Covid-19 patients and is available throughout the US by July 2020.

Strict safety and social distancing requirements for schools, businesses, retail stores, senior living facilities, and large public venues put in place in June will remain in place until a mass vaccine is available or herd immunity is developed. This looks like it will be well into 2021 before requirements are lifted.

US deaths from Covid-19 top 140,000 by the end of 2020.

US GDP is down 8.3 percent for 2020. It’s clear the world is in the Great Depression of 21st Century and that the downturn and recovery isn’t “V-shaped” or “U-shaped” but “L-shaped.”Half of the workforce is unemployed or underemployed. Official unemployment reaches almost 20 percent by July 2020 — unofficial numbers are higher as a percent of the working-age population — and remains at that level through the end of the year.

Official temporary homeless shelters (tent camps) are widespread on county and city land. Many apartments have non-paying occupants. Cities and counties can’t provide minimal support to the homeless and families struggling with basic health and food needs and are forced to cut all but essential services as tax receipts decline and social services costs explode. Many are facing bankruptcy.

Mass transit passengers are down 50 percent across the United States. Many people have switched to cars or are staying at home.Across all industries, 40 percent of small businesses have been forced to close their doors. 55 percent of small retailers that were open in February 2020 have been forced to close. Among restaurants and bars, 60 percent go under.

In many sectors, furloughed workers have returned to work, but companies are operating at reduced capacity and no one is hiring. The consumer discretionary sector has been hit particularly hard. Large retailers and airlines continue to seek protection from creditors by declaring bankruptcy. Business travel is off significantly. Boeing survives, but must make massive job cuts. New car demand is much reduced.

The impact on industries is very uneven. High-tech companies are stable, enabling the country to function. Shopping online is double what it was before the crisis. In Europe, shopping online rates before the crisis were between 15 and 20 percent; the rates in the US were likely similar.

Around the world, nations emerge from the lockdowns with national grievances and adopt protectionist policies. For 2020, global trade flows are down 40 percent compared to 2019. Demand for China manufactured goods has dropped, and China’s economy is decimated.  Chinese consumers aren’t spending either. China’s GDP decreases 7 percent in 2020. The EU is in similar disarray.

Since the beginning of the crisis, China has been concealing from its people and the rest of the world the disaster’s costs on its people’s health and economy, while whipping up nationalist sentiment. China abandons the one country, two systems principle for Hong Kong, declaring military law in the territory in order to ensure social order during the crisis. The United States and EU stand by.

Year: 2021

Strict social distancing requirements put in place in the summer of 2020 remain in effect until the end of Q2 2021. A vaccine is approved for mass production in January 2021, and supplies begin to have their intended effect beginning in Q2 2021.

By the end of 2021 another 40,000 people have died in the US from Covid-19, bringing the total from the pandemic to 180,000 deaths.

Real GDP growth for the US is a negative 0.2 percent in 2021. Cities and counties are overwhelmed by the large numbers of homeless and penniless people. Cities and towns across the United States declare bankruptcy. Many are forced to make cuts to public-sector pension benefits. Labor strikes in essential services (transit, law enforcement, schools) paralyze regions.

For the world, 2021 global trade volume is still 30 percent less than the peak in 2019. The World Trade Organization loses authority to arbitrate global trade and becomes a coordinator and information service on global trade. It’s clear that demand for China manufactured goods will never be the same because of trade barriers, and China’s economy falls another 2 percent in 2021.

US foreign policy is not to get pulled into any military confrontation that would divert financial and political capital away from domestic problems. In the winter of 2020/21 Russia overruns the three Baltic states, Estonia, Latvia, and Lithuania, and NATO stands by. China asserts that it controls the South China Sea; and China attempts to blockade Taiwan. The US Navy escorts ships in and out Taiwan waters, but can’t stop China’s expanding military presence in the Southeast Asia.

SCENARIO: RESILIENT

Themes of Resilient:

  • Covid-19 battle is won. States, operating as generals in the field, undertake different approaches fighting Covid-19. State lockdowns work initially to contain the virus, but the approaches for lifting lockdown measures and restarting their economies don’t work equally. However, the states show they are fast learners and drive Covid-19 infection rates down to safe levels. Total US deaths reach 250,000 at the end of 2021.
  • The US economy is knocked down, but it gets back up on wobbly feet. The pandemic causes significant damage to the US economy, but it’s functioning. A quick recovery is out of the question because of new safety restrictions, the high-unemployment levels, and the back-breaking debt loads everyone is carrying. Real GDP in the United States decreases 6.1 percent in 2020 and grows 2.1 percent in 2021. China’s economy has zero growth in 2020 and grows 5 percent 2021.
  • National and state policies to coordinate efforts on the healthcare and economic sides of the crisis emerge after ugly, drawn-out partisan debates. The federal government establishes a crisis council to coordinate US foreign-policy efforts for helping the rest of the world deal with the crisis. China attempts to expand its presence in Southeast Asia, but Southeast Asia countries, supported by the US defend their positions.

Three Months: April, May, and June 2020

Lockdowns continue in almost all US states into early May 2020 when the states say they have driven down the virus infection rate — also known as the reproduction ration (R0) — below 1.  The states implement plans with strict restrictions to reopen their economies. In states with large urban populations, masks are required in public, including indoors. Six-feet separation is required in schools and workplaces. After initial lockdowns are lifted, Covid-19 cases flare up across the country, but response efforts are good enough to manage the flare ups.

At the end of June, deaths attributed to the coronavirus exceed 120,000.

Some 30 percent of small retailers can’t reopen when the lockdowns are lifted, but other small businesses can. Large companies quickly restart, but plan to operate at reduced capacity for some time. Financial markets are functioning, but everything is dynamic.

Global trade is down significantly Q2 2020. Trade flows — measured by WTO’s volume index — are off 40 percent from Q2 2019. China efforts to restart its economy sputter, as the world isn’t ready to resume ordering supplies and products from China, and Chinese consumers aren’t spending yet.

Six Months: July through December 2020

Gilead’s drug remdesivir shows itself effective for broad use in sick Covid-19 patients and is available throughout the US by July 2020. New therapeutic drugs that show promise also begin to appear in July.

US deaths from Covid-19 top 180,000 by the end of 2020.

The US was fortunate that the Covid-19 crisis hit the country when its economy was in good shape. US GDP growth falls 6.1 percent for 2020.

Ridership on mass transit systems doesn’t return to pre-crisis levels. On average across the US, passenger levels are 20 percent down. There’s a dramatic shift to telecommuting by many workers, but the freeways are full of commuters.

Local governments struggle to create housing for the homeless, driven by newly displaced families. County social service programs are restructured to focus on essential services. Local government agencies undergo intense budget cutting efforts.

While a surprising number of small businesses were able to restart, only 40 percent of all small businesses survive until the end of December. Among the retail, entertainment, food services, hospitality, and personal services industries the survival rate is just 55 percent. Everything is different because business owners are adopting new processes and technology when they re-open, making them less costly, and more dependent on online systems.

Air travel is slow to recover. Personal and business travel are off significantly. New safety/health restrictions restrict cabin capacity. Boeing survives, but must make massive job cuts. Car demand is down.

Global trade decreases 30 percent in 2020 compared to 2019. All the G20 countries are suffering except China. China’s GDP growth is zero in 2020 despite the drop off in trade. Real GDP growth for the Euro area is a negative 8 percent for 2020, and EU member states confront the reality the EU was ill-equipped to help members during the crisis.

Geopolitical relations around the world worsen as nations erect trade barriers and reduce their dependence on Asian manufacturing. While the US attempts to rebuild its own manufacturing capability in certain industries, it still supports globalization and strives to bolster international trade. By default, the US is the global economic leader and endeavors to coordinate efforts to rebuild the global system.

Year: 2021

New therapeutic drugs begin to appear in January 2021, and the FDA approves a vaccine for mass production in May 2021.

New deaths from the virus in the US are 70,000 in 2021, bringing the total to 250,000 from the pandemic.

US GDP growth is 2.1 percent in 2021.

States and local governments survive by making large cost cuts, and with the help of a new federal government program, re-structure public-sector labor agreements on pension benefits.

For 2021 trade volumes are still 20 percent less than the peak in 2019. The US renegotiates trade agreements with major partners with the aim of increasing the country’s resilience during crises.

China’s GDP grows 5 percent in 2021.

SCENARIO: CHASTENED

Themes of Chastened:

  • A fierce battle continues to contain the virus. Much remains unknown, but facing severe economic hardships, states move to lift lockdowns as soon as possible. The nation learns to live with it. Covid-19 remains deadly for all of 2020 and much of 2021. US deaths from the virus hit 400,000 at the end of 2021.
  • The US economy absorbs a significant blow, but it is fighting. The measures to stop the virus in the first half of 2020 damage the US economy, but as lockdowns are lifted, local economies are rebounding slowly. Q2 2020 real GDP is 8.2 percent less than it was Q2 2019. As At the end of 2020, real GDP in the United States for all of 2020 is 4.1 percent less than it was in 2019. The US economy grows 3.8 percent in 2021. China’s GDP actually grows 1.1 percent in 2020, and 7 percent in 2021.
  • US government aid programs set up in the initial stages of the crisis — while expensive — help many small businesses stay alive until they can reopen. By the end of the summer 2020, the US is in recovery mode, stimulated by the states’ concerted efforts to get everyone back to work and federal cooperative efforts with the other G20 economies to stimulate trade. G20 countries lower trade barriers, improve technology protections, and rebuild some of their manufacturing capabilities.

Three Months: April, May, and June 2020

Many states and counties are experimenting with less-strict lockdowns in early May. As the lockdowns are lifted, communities are beset by flareups, some larger than the initial wave.Public health officials develop capabilities for rapidly re-imposing restrictions when outbreaks occur. While the R0 appears to be below 1 for most urban areas, the uncertainty surrounding the estimate remains high.

At the end of June, deaths attributed to the coronavirus exceed 120,000.

Mass transit systems implement measures to limit virus transmission, mandatory masks, train-car occupancy limits, etc. Ridership levels start low but grow. The freeways fill up quickly.

Government aid enables key industrial sectors and population segments to reopen immediately. The lockdowns spark innovations in government and industry. The use of online services explodes. A number of US companies begin building new manufacturing capabilities in the United States. The lending activities of financial institutions, both large and small, support the recovery. Many state government officials and insurers agree a way for business disruption insurance to cover pandemics.

Even though many survive, small businesses are hard hit by the virus. Many didn’t have the cash liquidity to survive weeks without any business. At the same time, everything is different. Business owners are adopting new processes and technology when they re-open, making them less costly, and more dependent on online systems. The overall survival rate of small businesses appears to be 75 percent.

In May and June, China ambitiously initiates a public-relations campaign to get foreign customers and companies to resume their China activities. Global trade flows — measured by WTO’s volume index — are down 40 percent in Q2 2020 compared to Q2 2019.

After most of the G20 countries open their economies by the middle of May, geopolitical-relations trends resume their course. For China and the US, relations are uneasy but there is good cooperation on health and trade issues. Global humanitarian efforts are focused on Africa and Latin America’s crisis needs.

Six Months: July through December 2020

Covid-19 remains very active and dangerous throughout the United States for all of 2020. Regions have widely varying incidents and experiences. In some, hospitals and intensive-care units are overwhelmed, and resources must be rushed in. Gilead’s drugs are better than nothing, but only reduce fatalities some.

Cooperation among the states and federal government is good. New clusters in senior living locations continue to be a problem, and strict measures are implemented by states for all complexes. Testing capabilities remains woefully inadequate throughout 2020. A different approach toward testing emerges in every region. Google/Apple’s second effort to set up a national database succeeds.

US deaths top 250,000 by the end of 2020

For all of 2020, US GDP growth shrinks 4.1 percent.

Local governments struggle to create housing for a growing homeless population, driven by newly displaced families. County social service programs are restructured to focus on essential services. Local government agencies undergo intense budget cutting efforts.
As regions open up, more workers telecommute, and college students spend less time in classrooms. Freeways are full, but mass transit systems are not. Ride-sharing businesses rebound well as people avoid mass transit.

US consumer spending picks up as the economy opens. Online sales do well, although much of the initial increased spending is at retail establishments. By the end of the year, it appears 65 percent of small businesses that were open in February 2020 have survived. Air travel increases quickly, but traffic levels are much reduced. New safety measures reduce the capacity of each plane, and discretionary travel for business and pleasure are down significantly. Boeing’s defense and civil aviation divisions emerge as independent companies. Car companies ramp up production after the shutdown, but recovery is slow as consumers delay making big ticket purchases.

China’s GDP grows 1.1 percent in 2020. The Euro Area suffers more than the US and China, shrinking 6 percent. Overall the global economy contracts by 4.7 percent in 2020 as the coronavirus pandemic caused nations around the world to close down. 2020 global trade flows are down 20 percent compared to 2019. Instead of following routes of national grievances and protectionism, country after country embraces the need for cooperation and shared solutions. China’s actions in Q2 2020 serve as a stimulus to the global economy and helped maintain China’s role as the manufacturing hub. The US and China modify their tariff agreements to lower most of the tariffs.

Year: 2021

New therapeutic drugs don’t appear until early 2021. No vaccine is found, but the heavy wave of infections across the country hopefully means a herd immunity is being developed.

Deaths in 2021 from Covid-19 are still high, topping out at 150,000 for the year. The two-year total is 400,000.

The US economy shows real GDP growth of 3.8 percent in 2021.

In the second year, the economic outlook for G20 economies is optimistic as global trade picks up. The United States asserts its leadership of the global economy by adopting policies to lower trade barriers, improve technology protections across borders, and still build nation-economy safeguards.

US/China relations are relatively stable. China still treats all discussions of re-structuring the global trade system as threats. 2021 global trade volume is up 10 percent over 2020.
China’s GDP grows 7 percent for 2021. The EU’s GDP is a positive 2.5 percent for 2021, while Japan grows 3 percent.

What Would You Do?

The scenarios are extreme, but plausible. Every household, business, nonprofit, or government agency can use the scenarios to help them figure out what they should do over the next two years. Ask yourself with each scenario, how well would my current plan fare in this scenario? What would I do differently if I knew this scenario were going to occur?  After thinking about each scenario’s challenges, what should my plan be knowing that any of these scenarios could occur?

Natural Gas: Make or Break National Policy Issue

Natural gas policy decisions in the next 30 years could make or break nations. They will be critical in the long-term health of the economy, a country’s geopolitical partners, and its energy security. Many developed countries are focused on moving as fast as they can toward renewable-energy sources and ignoring the risks of making this humongous bet on relatively unproven technology. Developing countries aren’t likely to move rapidly toward renewable sources, and will likely take advantage of the plentiful, low-cost natural gas that will be available for the foreseeable future. Progress toward having substantially more renewable-energy sources might be better achieved and faster if natural gas were the essential partner in every country’s energy strategy. Natural gas could be the great enabler: It could enable renewables to be developed more effectively; it could enable energy security for countries making the transition away from coal; it could enable a robust and resilient national economy in the next fifty years; and it could enable faster progress toward reducing climate-change emissions.

RECENT SIGNALS OF CHANGE

The new availability of low-cost natural gas has dramatically altered the economics of energy production and the strategies for combating global carbon emissions around the world.

  • Gas is turning into a better opportunity than oil for many producers. The technology of shale oil production continues to advance steadily in spite of or perhaps because of low hydrocarbon prices. Over the last five years, production well productivity has risen more than 400%, 40% in the last year. US exports of natural gas have just exceeded US gas imports for the first time in 60 years with most of the export increases going to Mexico and Canada. From 2000 to 2015, the percentage of total energy production of natural gas in Shell, Eni, Total, ExxonMobil, ConocoPhillips, and Chevron went up significantly. Only in BP did it go down slightly. In Shell, Eni, and Total the share of natural gas is almost 50 percent.
  • New environmental risks from natural gas operations are coming to light. Recent figures indicate that around a third of the annual methane emissions in the United States can be traced to the natural gas industry. While methane doesn’t remain in the atmosphere as long as carbon dioxide (12 years compared to 500 years), it is about 25 times more potent as a cause of global warming. The Environmental Defense Fund, an American NGO that often works with industry, estimates 2-2.5% of the gas flowing trough the supply chain leaks out.
  • Global oil supply has steadily risen—almost 20 percent—since the year 2000 to over 95 million b/d in 2016, with non-OPEC producers leading the charge, competing strongly with OPEC producers for market share. In 1995, proven oil reserves (i.e., oil discovered and economic to produce) in the world were 120 trillion cubic meters. In 2015, proven oil reserves were 187 trn cubic meters.

Shipping of natural gas is rapidly becoming global, not local.

  • A single global market for natural gas is emerging. Natural gas is starting to be bought and sold around the world just like oil and petrochemicals. Behind this revolution is improved technology for moving gas as a liquid, flexible contracts, and new global capacity for sending and receiving LNG shipments. The share of gas moving by sea reached 40 percent of total trades in 2015 and according to the IEA will account for a bigger share of trading than pipelines by 2040. Thirty-nine countries now import LNG compared to 17 ten years ago.
  • Qatar is the world’s largest supplier of LNG with a market share of nearly one-third. In 2016, Qatar shipped 77.2 million metric tons (mmt) for 30.0 percent share and Australia shipped 44.3 mmt for a 17.2 percent share. Australia is expected to overtake Qatar based on current development plans in 2019 with at least 80 mmt. Ironically, Adelaide, Australia, suffered recent power blackouts during a nationwide heat wave because lack of investment in the country’s natural-gas infrastructure. The next big exporters were Malaysia, Nigeria, Indonesia, Algeria, Russia, Trinidad, and Oman.
  • The world’s seas are becoming more efficient in moving natural gas. The major Panama Canal expansion, opened in June 2016, more than doubles the canal’s capacity and includes a third lane to accommodate ships large enough to carry 14,000 TEU. A key market of the future for the canal could be LNG carrier traffic. Also, Russia’s US$27 billion Yamal LNG project within the Arctic Circle will begin operation in 2017. This remarkable project will use West-designed and Far East-built ice-class LNG tankers to enable year-round export shipments from northwest Siberia to European and Asian markets. The LNG tankers are intended for navigation both westbound and eastbound along the Northern Sea Route (NSR), the Arctic seaway along Russia’s coast linking the Atlantic and Pacific. The Russian company, Novatek, has a 50.1% interest in Yamal LNG; China National Petroleum Corporation and France’s Total Group both have a 20% holding; and the Chinese state-owned Silk Road Fund has a 9.1% interest.

China and India are reshaping their energy supply and demand mix and their foreign trade in energy commodities. China is proceeding faster than India.

  • In 2000 China and India didn’t have any LNG imports. In 2016 they are the third and fourth largest importers after Japan and South Korea. The United States and China are currently negotiating a trade deal that could involve US LNG shipments to China.
  • China Petroleum & Chemical, or Sinopec, is attempting to double domestic natural gas production in the next five years by rapidly expanding natural gas production from shale reserves in order to reduce coal usage in the country and reduce China’s need for imported liquefied natural gas. Many investors around the world were counting on sending natural gas to China.
  • Asia accounts for two thirds of the world’s coal demand, but that demand may be falling and sooner than everyone’s base-case scenarios show. In China in 2016, coal consumption fell 4.7 percent. This was the third year in a row of declining use. Coal currently supplies about 70 percent of China’s electricity, but the Chinese government is focused on cutting coal’s use, and succeeding. Coal-fired plant capacity in China is still being added—in November 2016, China’s National Energy Administration announced it is raising coal-fired power capacity as much as 20 percent by 2020, from 900 gigawatts in 2015 to as much as 1,100 gigawatts by 2020—but capacity utilization of coal plants has fallen steadily in China from around 60 percent in 2010 to around 50 percent in 2016. It appears coal will only provide 55 percent of China’s electricity mix in 2020.
  • Coal makes up 61 percent of India’s power-generating capacity, but India has announced it doesn’t need any new coal-fired power stations in the next decade beyond what it is currently building. Capacity utilization of coal plants has fallen steadily in India from over 75 percent in 2010 to less than 60 percent in 2016. Even with the rapid economic growth of the last decade, about 40 percent of India’s coal-fired power plants are now idle because of weaknesses in the distribution system and because government planners overestimated the growth in demand.

US electricity generation from natural gas now exceeds that from coal.

  • In 2016, natural gas’s share of US electricity generation at 33 percent exceeded coal’s share at 32 percent for the first time. Coal’s share has steadily fallen from a high of over 55 percent in the mid-1980s, while natural gas’ share has steadily risen from about 10 percent then. Nuclear remains steady at 19 percent, while renewables, not counting hydro, have risen from zero in the mid-1980s to 8 percent in 2016.
  • The Tennessee Valley Authority historically has been a major user of coal plants, but that has changed radically since 2007 because of environmental agreements to reduce coal emissions, the lower prices of natural gas, and increased production from nuclear. In 2007, over 55 percent of TVA’s energy mix was coal; in 2017 a little over 20 percent of the mix will be coal. Since 2011, TVA has shut down 24 coal-fired units out of 59 in its network.

LNG supplies are changing some countries’ dependence on pipeline gas that comes from other countries, that runs through unfriendly countries, or both. Poland’s new LNG import terminal reduces its reliance on gas from Russia.

In developed countries, wind and solar renewables are beginning to change radically the energy supply mix.

  • In 2015 5.5 percent of the world’s electricity came from wind and solar. Hydropower, wind, and solar together produced 9.4 percent of the electricity. The International Energy Agency said in July 2017 that for the first time the amount of renewable capacity commissioned in 2016 almost matched that for other sources of power generation, such as coal and natural gas. In some countries, solar photovoltaics are cheaper than coal and gas.
  • An interesting example of where wind and solar renewables are becoming a significant energy source is Texas, the center of the US oil and gas industry. In 2001, renewables (wind, solar, and hydro) accounted for 2% of Texas energy; in 2016 they will accounted for 16%. One night this past winter, nearly 50% of the power flowing into the Texas grid came from wind turbines in the state. Federal subsidies for Texas renewables have been a big factor, but equally big have been the falling costs of solar and wind technology.

 The electricity system around the world is fundamentally changing because of the orchestrated growth in the use of renewables largely with subsidies. The costs of these subsidies were modest when the renewables contribution to overall energy supply was marginal, but that’s changing. Since 2008, public subsidies for renewables have been $800 billion. In 2014, the IEA estimated that decarbonizing the global electricity grid will require $20 trillion in investment in the next 20 years, and that still leaves much to be done. A new economic system for electricity is required, but the ecosystem of energy and the economy is too complex for anyone to know what that should be and how to make the changeover efficiently. Source: The Economist, “A world turned upside down,” February 25, 2017, pp. 18-20. Other risks of investing in renewables include the new technology uncertainty and costs, and the many, many land-use, energy, and environmental regulations in place that are just as big hurdles for renewables as they are for the other energy supply investments.

Nuclear energy plants are progressing in many parts of the world, but not in the United States and Germany. Electricity from US nuclear plants at about 1.5 mega-watt hours per year is expected to decline very slowly over the next 25 years as reactors close and aren’t replaced. Toshiba’s subsidiary, Westinghouse, recently declared bankruptcy over escalating costs involving billions of dollars to finish two nuclear power plants in South Carolina and Georgia. Both plants might not be completed. 

The International Energy Agency (IEA) report on CO2 Emissions from Fuel Combustion highlighted that the growth in global CO2 emissions was slowing down. In 2014, the IEA indicated the global CO2 emissions were 32.4 gigatons of carbon dioxide (GtCO2), an increase of 0.8 percent over 2013 levels. The growth in 2013 over 2012 levels was 1.7 percent, while the average annual growth rate since 2000 has been 2.4 percent. Work by the Intergovernmental Panel on Climate Change (IPCC) shows that holding warming to 2°C typically requires global annual emissions to peak sharply around 2020, fall steeply by 50% before 2040, and be close to net zero towards the end of the century. The EIA’s International Energy Outlook 2016 reference case has global energy-related CO2 emissions growing about 1 percent/year from 2012 to 2040, but will CO2 emissions peak much sooner than anyone expected? 

Governments around the world are already adopting major plans to transition to renewable energy in spite of major uncertainties about the costs and plausibility of those plans. In a June 2017 paper in the Proceedings of the National Academy of Sciences, 21 energy researchers rejected in no uncertain terms Stanford Professor Mark Jacobson’s 2015 study that made a case for 100 percent renewable energy by 2050. They wrote Jacobson’s plan “can, at best, be described as a poorly executed exploration of an interesting hypothesis. The study’s numerous shortcomings and errors render it unreliable as a guide about the likely cost, technical reliability, or feasibility of a 100 percent wind, solar, and hydroelectric power system.” In other words, it was crap. The problem is that governments around the world— Germany, California, and Portland, Oregon—are already implementing extensive plans to transition to renewable energy. Germany’s goal is 80 percent renewable by 2050; California is trying to set a goal of 60 percent by 2030; Portland wants to be using 100 percent clean power by 2035. 

Even if oil demand peaks in the foreseeable future and the world achieves a net-zero emissions state, oil and natural gas will continue to be key energy sources. Shell’s scenario group in May 2016 highlighted that for the future global population of 10 billion people to have a decent quality of life, the global energy needs would have to double by the end of the century. Oil and natural gas would have to remain important energy sources for the next forty years, until solar, wind, and nuclear sources can assume the burden of meeting the global economy’s needs. If the net-zero emissions state is reached, let’s say by the end of the century, the share of oil and gas in the overall energy mix will have fallen from 57 percent to around 15 percent, while the non-fossil-fuel share would be just under 80 percent. 

ORACLE MUSINGS ABOUT ENERGY, ECONOMIC, AND SECURITY OUTCOMES

Depending on what natural gas policy decisions are made, world economic, political, security, and environmental outcomes in the next twenty years could be very different.

For the next 20 years the demand for natural gas is likely to explode.

  • Natural gas production could grow even more than base case scenarios because of technology innovation, rapid development of LNG shipping infrastructure, new government restrictions around the world on use of coal in power generation, and high costs of clean coal technology.
  • Technology innovation will likely continue to lower the costs of shale gas development. China and Argentina could see rapid expansion in their natural gas productions.
  • Global shipments of LNG will expand rapidly as more infrastructure for receiving LNG is built in countries around the world. Since most of the shipments will be headed toward Asia, issues around the security of shipping lanes in Asian waters will develop.
  • Russia leverage will both increase and decrease because of natural gas. Many traditional buyers of Russia’s gas will strive to reduce their dependence on Russian piped gas by investing in LNG. At the same time, Russia will be able to serve the new LNG markets.

Future of coal: Global coal demand could begin to fall soon.

  • The momentum to substitute natural gas for coal in electricity generation will likely accelerate.
  • Coal use will likely continue to decline in the United States. It’s uncertain how Trump administration policies could affect that decline, but in general the trend won’t likely reverse.
  • The biggest changes in coal usage could be in China and India. If natural gas prices remain low, coal demand will most likely keep falling. In fact, China and India could struggle to keep up with the forces driving those declines.
  • Clean coal technologies will likely struggle to become commercial. Consequently, in a couple of years, new coal plants may never be built again in a large industrial economy.

The biggest economic winners of using more natural gas could be the rapidly growing Asian economies, particularly China.

  • Natural gas supplies could help meet the extensive energy growth needs throughout Asia, and enable Asian countries to move faster away from coal.
  • China companies will likely continue to be industrial leaders in all commodities, including oil, gas, and coal. The Chinese companies will continue to be the biggest, invest the most money, and generally be aggressive to capture the most market share.
  • China could bet big on natural gas for its economy. It could expedite LNG receiving facilities and new natural gas burning power plants.
  • China’s changing policies toward improving the country’s air quality and energy supply in the next ten years could have the greatest impact on global CO2 emissions and the world’s goal of reaching a net zero CO2 emissions state as soon as possible.
  • China will likely ride the wave of coal use reduction and assume a much large leadership role on environmental issues in international forums, like the IPCC.
  • In many respects, India’s accomplishments will be greater, but they will follow China’s.

National energy plans in developed economies may not fit with reality.

  • Germany and California and others focused on making a complete transition to renewable sources as fast as possible could struggle with their goals. Physical and financial barriers could be too large to reach 50 percent of power from renewable sources. Disruptions in power services could increase. The goals will likely stay in place, but the old energy systems could remain critical.
  • Nuclear power could gain more advocates and expand, but not likely unless major problems with renewables appear.

Renewable power could expand more rapidly than projected in rapidly developing economies.

  • For many countries, in ten years more than 50 percent of new power capacity will be from renewables sources. Major investments in infrastructure for using more renewable technologies will be made.
  • Chinese corporations will likely continue to invest heavily toward becoming global leaders in renewable-energy technologies, like solar electricity generation and electric cars.
  • If net CO2 emissions per year start falling, societies could struggle to maintain their commitments toward renewables.

The battles over the development and use of fossil fuels could become even more intense.

  • Greenhouse gas emissions will likely continue to accumulate in the atmosphere and ocean for the foreseeable future. CO2 emissions from gas will continue to grow because of the growth in natural gas production.
  • NGO’s will likely continue to object to natural gas and oil development and production activities and the companies that conduct them.
  • Gas companies are unlikely ever to be viewed as good world citizens.
  • Large private oil and gas companies could experience more protests wherever they operate.
  • Russian and Chinese companies will likely be singled out more and more by NGOs.

New economic system for electricity will emerge over the next 15 years: But no one can predict the dynamics of that system because there are too many uncertainties in technology, geopolitics, human behavior, climate change, energy supply sources, energy demand, and economics. The wide range of possible outcomes include:

  • A very unreliable electricity delivery system, with major disruptions, could develop in major industrial economies, particularly those with the biggest commitments toward renewables.
  • On the other hand, an integrated system of diverse power sources with higher electricity prices could develop that is much more efficient and robust than current systems.


Developing Intelligence for a Complex World

THE ORACLE’S SECRETS TO PRODUCING BETTER FORESIGHT

We’ve always assumed oracles of the future got their answers from breathing mountain air or from the gods looking down. The reality is the good oracles were canny oracles that did their homework first before delivering their fateful responses. They had access to great intelligence networks to help them, and most importantly before they gave a foresight response to a tough question they purposely disturbed the dynamics of the situation using quick probes to see what information would be revealed. We can’t look at a used car and expect to know how it will run; we have to kick the tires, turn on the engine, and give the car a test ride to have any sense of the future. Good oracles understood they weren’t passive participants in how the future played out; they were active, engaged ones. Whatever they said or did could influence the final outcome. Before delivering their foresight response, which was irreversible, they probed or stimulated the complex environment to see what possible behaviors could develop.

In modern day organizations, oracles have been replaced by effective intelligence practices that focus on getting “intelligence from the trenches,” conducting as much experimentation and testing in the market as possible, and learning quickly from emergent behaviors in the market. Google and Amazon have created amazing probing or active-intelligence capabilities that should enable them to remain very competitive for the foreseeable future.

INTELLIGENCE NEEDS FOR COMPLEX ENVIRONMENTS

Real-world environments are very messy. They evolve in nonlinear ways and are largely unpredictable. Even with a computer, we barely understand how the many forces interact and behave. We can have voluminous information about a situation, but it’s always very incomplete, often inaccurate, and very hard to integrate and analyze quickly. We generally have limited insight about the individual forces shaping the situation and the situation as a whole, and only understand in retrospect why things happened. We need intelligence practices that will help us better understand the situations we’re facing, that will coax out better foresights about future threats and opportunities, and that will enable us to act effectively in response to the changing environments.

Our intelligence needs start with understanding better the dynamics of complex environments. Real-world environments are complex because many interrelated forces interact unpredictably. Change in one type of force, social or economic or physical, inevitably affects the others, but the unfolding behavior of the system cannot be predicted by understanding the individual forces or any set of force interactions. Importantly, every stakeholder in a situation is a force, playing a role and acting on the other forces.

A complex environment is simultaneously dynamic and resilient. Resilience is the capacity of the environment to absorb disturbance, to undergo change, without crossing some threshold to chaos and a different dynamic. This capacity to undergo some change without a radical change in general dynamic is defined as the resilience of the system. The more resilient the system, the more anti-fragile (a term from Nassim Nicholas Taleb, the author of The Black Swan and Antifragile: Things That Gain from Disorder) it is.

The complex social-physical system becomes unstable and chaotic when changes in the interlinked forces result in thresholds being crossed. Shocks and disturbances to a system, such as from a natural disaster, technological disruption, etc., can push a system across thresholds into a different state or dynamic, often with unwelcome surprises. An accumulation of nonlinear changes can also push a situation over thresholds. Eventually the system reconfigures into the new dynamic and state with new thresholds.

Complex environments can be defined at many levels or scales. The highest level is the Earth system, but any real world issue, like the copper commodity market, the urbanization of Southern California, the development of renewable-energy sources in Europe, or migrations in Europe, can be defined as a complex situation.

Facing complex situations creates a number of strategy and intelligence challenges for organizations.

  • First, because real world situations are interactively complex and non-linear, they are difficult to explain, let alone predict some cause and effect. A relatively minor action like publicizing a foresight of the future can create disproportionately large effects. When Elon Musk makes a market prediction, he can have a large impact. However, the same prediction for the same issue at a later time may produce a different effect.
  • Second, each situation is unique and novel. Historical analogies can provide useful insights on individual aspects of the larger issue, but the differences among even similar situations can be profound and significant. The political goals at stake, the stakeholders involved, the cultural milieu, the histories, and other dynamics are unique.
  • Third, a complex situation can’t be known, only surrounded. The organization’s understanding of the issue depends on who’s involved, and each individual will see the relationships between the forces driving the situation and their importance differently.
  • Fourth, every description of the issue points in the direction of a set of foresights. The description puts blinders on what we see as foresight. For example, if one describes bankrupt commodity producers as the result of falling demand and lower commodity prices from a weak economy, the foresight of the future will be different than if we describe bankrupt commodity producers as the result of building too much supply capacity.
  • Fifth, any stakeholder’s action, including its intelligence activities, can disturb a situation with non-linear effects.
  • Six, real-world situations have unlimited possible outcomes; there’s no fixed set of possibilities. Also, there’s no way of knowing if many of the foresight possibilities have been identified and considered.
  • Seventh, foresight ideas for an issue are better or worse, not right or wrong. The suitability of a foresight and its perceived quality will depend upon how individual stakeholders have understood the situation and what constitutes success for them. The perceived quality of a foresight can change over time; yesterday’s foresight might appear good today, but disastrous tomorrow.
  • Eighth, every foresight for a real-world situation is a ‘one-shot operation.’ The interactive dynamics of a situation are continuously creating a new situation and cannot be undone. The consequences of change are effectively irreversible.
  • Ninth, real-world situations have no ‘stopping rule’. It is impossible to say conclusively that a situation has been resolved. Work will continue on an issue until strategic leaders judge the situation is “good enough,” or until stakeholder motivations, will, or resources have been diverted or exhausted.

ORACLE SECRETS FOR COMPLEX ENVIRONMENTS

Based on these challenges, we can surmise what were the secrets of the good oracles. How did they come up with good foresight for the tough questions of the day? There were seven things.

First, good oracles did their homework before coming up with a foresight response to a tough question posed to them.

Second, good oracles had intelligence teams to assist them. An oracle must develop a superior ability to identify signals of change from the external environment and see the new possibilities for all the players. The oracle needs a team to accomplish this and the team must specialize in watching complex situations—watching non-linear dynamics, emergent behaviors, etc., identifying the key uncertainties and the ranges of possible outcomes, spotting signals of change, gathering new data, managing probes in intense environments, and developing new insights on threats and opportunities. Oracle team persons need to have an entrepreneurial mindset to operate in those fluid situations, work with the open network, and communicate their insights upward. They must be able to recognize new patterns in a changing environment, know which types of relationships within the network are crucial at specific times, and mobilize relationships in order to accomplish objectives.

Third, good oracles developed a wide network of sources in the field, a network of players well beyond traditional players and boundaries.

Fourth, good oracles recognized they’re not outside observers in unfolding dramas, but active players in those dramas. Like every other player, an oracle action—particularly its foresight response—can shape the situation’s dynamics and possible outcomes.

Fifth, before settling on a foresight response, oracles first stretched their teams to identify the full range of possible dynamics in a situation and outcomes. The teams did this by focusing their intelligence activities on the big uncertainties, developing an understanding of the conditions from which opportunities or threats could emerge, and identifying the threshold boundaries—the tipping points—beyond which the possible outcomes and dynamics would change in chaotic ways. Very often the big uncertainties would be about the various players, who could emerge, how anyone might behave, etc. But there were many other possible big uncertainties—technology innovations, the success of new products and services, and local government rules.

Sixth, oracles extensively used probes. Instructive patterns can emerge from complex dynamics, if one can disturb or probe the situation and watch the effects. Probes can be a field test of a new product, an external-stakeholder interview, a publication of a blog, the posting of something to sell on eBay, etc. The objective was to coax out information about a major uncertainty, particularly about how key players might behave, so the oracle team could develop a better foresight response. Most probes will fail to produce anything, so oracles need a portfolio of them to create the opportunities for informative patterns to emerge.


Finally, good oracles made most of their money from retainer services because real-world situations rarely got resolved and clients wanted timely foresight updates. In fact, clients needed the oracles’ coherence in the midst of all the change, for seeing how the situational players were learning and adjusting to the changing dynamics. So good oracles developed processes for ongoing development of their network, watching of the dynamics of a situation, and probing the situation to stimulate new intelligence, if necessary.

HIGH TECH’S RELIANCE ON PROBES

In modern day organizations, oracles have been replaced by effective intelligence practices. Twenty years ago, Richard Pascale, former McKinsey consultant and Stanford Business School professor, described in a Sloan Management Review article, “Surfing the Edge of Chaos,” a set of strategic principles for organizations operating and competing in complex ecosystems and how Royal Dutch/Shell was attempting to apply those principles. One key principle was that in a world constantly evolving in ways one can’t predict, where one has a limited ability to understand the world and shape events and outcomes, organizations succeed best not by trying to control an unpredictable environment but by constantly disturbing it. Another principle was that decentralized organizational units were best positioned to develop the intelligence and insight for responding to the changing environment that was changing often in non-linear ways. At the time of the article, Royal Dutch/Shell was implementing a new management system that would rely on “intelligence from the trenches,” involve as much experimentation and testing in the market as possible, concentrate on rapid learning, and implement continuously adapting action plans. That new management system of Royal Dutch/Shell characterizes the approach many fast-growing corporations use today.

Probes are the techniques for generating intelligence from the trenches—by making small disturbances—and conducting market experiments and tests. They are the product tests, product announcements, market experiments, and interviews designed to get stakeholder responses. Probes are the means for resolving the uncertainties about what the stakeholders might do in the future. Will customers buy this new product idea? How might regulators respond to the new product or service? How might suppliers and competitors respond? Probes can be used to reveal emergent strategies of new entrants.

Online environments have totally changed how companies conduct probes. For example, the use of online surveys and tools like Survey Monkey has transformed how consumer research is done around the world. Corporations that compete in online industries and have access to millions of online users or customers are creating significant competitive advantages for themselves through their probes. They can run many probes, quickly, for little cost and are leveraging that capability to build their new products or services. Probes are a key for leveraging big data.

A major strategy of online companies is “ship and iterate.” This is essentially a strategy that leverages probing skills to commercialize a new product or service. The company doesn’t focus on getting a perfect first product introduced online but instead they initially make available online a close-enough product and then focus on iterating quickly to get improved versions into the hands of users. That first product shipment is in effect a big probe and generates a lot of useful information even if the product fails.

Google finds some of the most important data from the product-shipment probe is the negative feedback because it’s so motivating to the product development team. Google also believes in soft launching new products—i.e., only providing minimal marketing and public relations support with the initial launch, forcing the new product to gain momentum and succeed on its own.

Amazon believes speed matters with new products or services and, when there’s uncertainty about what might happen, it just tries something and takes advantage of the opportunities stimulated by doing something first in the marketplace. Being first also attracts to your product or service the critical segment of users and customers that is strategic and risk-taking—the innovators and generates for you the first feedback information from the marketplace that no one else will have. This bias for action is a characteristic of Amazon’s culture that is focused on continually trying to improve customer experiences.

For online and software companies, it’s easy to ship a new product or version. For hardware companies, it’s a little more difficult, but cost-effective probes can still be created. Online environments have enabled for hardware companies an array of new approaches and technologies for generating and testing product and market ideas fast, at low cost, and with not-much risk. For example, one can ship the design of the hardware, or one can create a virtual model that users can play with.

Peak Coal Demand? Followed by Peak CO2 Emissions?

ORACLE’S RESPONSE

Global coal demand could peak much sooner than what the major reference scenarios of the US Energy Information Administration and International Energy Agency currently show. China’s and India’s changed outlooks for coal demand would be the biggest factor in demand peaking sooner, driven by China’s clean air concerns, falling energy intensity of economic growth in China and India, and rapidly expanding supplies of natural gas around the world. If that’s the case, it’s plausible CO2 emissions could also peak in the next 10 years. Increased momentum will develop for the policies that contributed to reaching this tipping point. A new economic system for electricity will emerge in the next 15 years, but no one can predict what the dynamics of that system will be because of the uncertainties. China and India could emerge as the global leaders on energy and the environment if they’re able to achieve economic success without the energy intensity required by OECD countries.

RECENT SIGNALS OF CHANGE

Demand for electricity in Asia is surprising stagnant and this is affecting coal demand. Apparently, the falling energy intensity of economic growth wasn’t taken into account very well.

  • Asia accounts for two thirds of the world’s coal demand, but that demand may be falling and sooner than everyone’s base-case scenarios show. In China in 2016, coal consumption fell 4.7 percent. This was the third year in a row of declining use. Coal currently supplies about 70 percent of China’s electricity, but the Chinese government is focused on cutting coal’s use, and succeeding. Coal-fired plant capacity in China is still being added—in November 2016, China’s National Energy Administration announced it is raising coal-fired power capacity as much as 20 percent by 2020, from 900 gigawatts in 2015 to as much as 1,100 gigawatts by 2020—but capacity utilization of coal plants has fallen steadily in China from around 60 percent in 2010 to around 50 percent in 2016. It appears coal will only provide 55 percent of China’s electricity mix in 2020.
  • Primary energy demand in China declined in 2015, the first fall in 20 years. Despite recent years of little or no growth in demand for power in China, the government is forecasting growth of between 3.8 percent and 4.6 percent by 2020. China continues to dominate major industries that use a lot of electricity, but environmental problems from heavy manufacturing are influencing national government policies. China’s aluminum production accounts for more than 50 percent of world production. China’s production grew 60 percent from 2011 to 2016, reaching 31 million tons in 2016. Aluminum production is an energy-intensive process and China’s aluminum smelters receive 90 percent of their power from coal. In the world steel industry with global oversupply, China, the world’s number one steel producer, has been producing steel at a record pace.
  • Coal makes up 61 percent of India’s power-generating capacity, but India has announced it doesn’t need any new coal-fired power stations in the next decade beyond what it is currently building. Capacity utilization of coal plants has fallen steadily in India from over 75 percent in 2010 to less than 60 percent in 2016. Even with the rapid economic growth of the last decade, about 40 percent of India’s coal-fired power plants are now idle because of weaknesses in the distribution system and because government planners overestimated the growth in demand.

The coal reference case in US Energy Information Administration’s (EIA) International Energy Outlook 2016 has world coal consumption increasing from 2012 to 2040 at an average rate of 0.6 percent/year. Much of that increase is from India. What if China’s coal consumption is peaking now and not in 2025? And what if India’s large increase in demand for coal over the next 25 years doesn’t materialize?

Plenty of oil and gas is around and few limitations to producing more.

  • Global oil supply has steadily risen—almost 20 percent—since the year 2000 to over 95 million b/d in 2016, with non-OPEC producers leading the charge, competing strongly with OPEC producers for market share. In 1995, proven oil reserves (i.e., oil discovered and economic to produce) in the world were 120 trillion cubic meters. In 2015, proven oil reserves were 187 trn cubic meters.
  • Fueled by commodity prices, particularly oil exports, sovereign-wealth funds—financial vehicles owned by governments—doubled in size from 2007 to 2015 to $7.2 trillion. Since 2007, the number of sovereign funds increased by 44 percent to 79, many in Africa and Asia. Nearly 60 percent of sovereign wealth fund assets are related to energy exports. Many sovereign-wealth funds, including most likely several from the Middle-Eastern oil exporters, came to the aid of the Russian Direct Investment Fund when US and European sanctions restricted business between the Russian fund and Western companies.
  • Developing economies account for 43 percent of global GDP but 65 percent of crony wealth. Crony capitalism is where an individual’s wealth stems from a special relationship with the government. Since globalization took off in the 1990s, the wealth of billionaires in high-crony industries, like natural resources, real estate, construction, telecoms, and defense where there’s a lot of interaction with the state or are licensed by it, grew substantially in developing countries. Russia’s crony industries represents approximately 18 percent of Russia’s GDP.
  • The world’s seas are becoming more efficient in moving hydrocarbons. The major Panama Canal expansion, opened in June 2016, more than doubles the canal’s capacity and includes a third lane to accommodate ships large enough to carry 14,000 TEU. A key market of the future for the canal could be LNG carrier traffic. Also, Russia’s US$27 billion Yamal LNG project within the Arctic Circle will begin operation in 2017. This remarkable project will use West-designed and Far East-built ice-class LNG tankers to enable year-round export shipments from northwest Siberia to European and Asian markets. The LNG tankers are intended for navigation both westbound and eastbound along the Northern Sea Route (NSR), the Arctic seaway along Russia’s coast linking the Atlantic and Pacific. The Russian company, Novatek, has a 50.1% interest in Yamal LNG; China National Petroleum Corporation and France’s Total Group both have a 20% holding; and the Chinese state-owned Silk Road Fund has a 9.1% interest.
  • Gas is turning into a better opportunity than oil for producers. The technology of shale oil production is rapidly advancing despite current cost constraints. Over the last five years, production well productivity has risen more than 400%, 40% in the last year. US exports of natural gas have just exceeded US gas imports for the first time in 60 years with most of the export increases going to Mexico and Canada. From 2000 to 2015, the percentage of total energy production of natural gas in Shell, Eni, Total, ExxonMobil, ConocoPhillips, and Chevron went up significantly. Only in BP did it go down slightly. In Shell, Eni, and Total the share of natural gas is almost 50 percent.
  • However, new environmental risks from natural gas operations are coming to light. Recent figures indicate that around a third of the annual methane emissions in the United States can be traced to the natural gas industry. While methane doesn’t remain in the atmosphere as long as carbon dioxide (12 years compared to 500 years), it is about 25 times more potent as a cause of global warming. The Environmental Defense Fund, an American NGO that often works with industry, estimates 2-2.5% of the gas flowing trough the supply chain leaks out.

In developed countries, wind and solar renewables are contributing to the changing the energy supply mix. Will this momentum change with lower hydrocarbon prices? A key signal is that wind and solar renewables are becoming a significant energy source in Texas, the center of the US oil and gas industry. In 2001, renewables (wind, solar, and hydro) accounted for 2% of Texas energy; in 2016 they will account for 16%. One night this past winter, nearly 50% of the power flowing into the Texas grid came from wind turbines in the state. Federal subsidies for renewables have been a big factor, but equally big have been the falling costs of solar and wind technology.

With renewables expected to account for half of the growth in global energy supply over the next 20 years, the costs of the changeover will be huge. The electricity system around the world is fundamentally changing because of the orchestrated growth in the use of renewables largely with subsidies. The costs of these subsidies were modest when the renewables contribution to overall energy supply was marginal, but that’s changing. Since 2008, public subsidies for renewables have been $800 billion. In 2014, the IEA estimated that decarbonizing the global electricity grid will require $20 trillion in investment in the next 20 years, and that still leaves much to be done. A new economic system for electricity is required, but the ecosystem of energy and the economy is too complex for anyone to know what that should be and how to make the changeover efficiently. Source: The Economist, “A world turned upside down,” February 25, 2017, pp. 18-20.

US electricity generation from coal shrank from its peak in 2008 at slightly more than 2 billion megawatt-hours to about 1.3 billion mega-watt hours in 2016.

  • In 2016, natural gas’s share of US electricity generation at 33 percent exceeded coal’s share at 32 percent for the first time. Coal’s share has steadily fallen from a high of over 55 percent in the mid-1980s, while natural gas’ share has steadily risen from about 10 percent then. Nuclear remains steady at 19 percent, while renewables, not counting hydro, have risen from zero in the mid-1980s to 8 percent in 2016.
  • The Tennessee Valley Authority historically has been a major user of coal plants, but that has changed radically since 2007 because of environmental agreements to reduce coal emissions, the lower prices of natural gas, and increased production from nuclear. In 2007, over 55 percent of TVA’s energy mix was coal; in 2017 a little over 20 percent of the mix will be coal. Since 2011, TVA has shut down 24 coal-fired units out of 59 in its network.

Clean coal technologies are not economic yet, and maybe never will be. Southern Co. also announced in February 2017 that the first of its kind “clean coal” power plant is almost complete, but that it won’t be economic to operate the plant competing against natural gas power plants using today’s low gas prices. The new coal plant that will be able to burn coal and capture the carbon-dioxide output has taken 7 years to complete and cost $7.1 billion to build. If Southern had built a natural-gas power plant of comparable size, it would have cost about $700 million to build—one-tenth the cost of the clean coal plant.

Given all the changes and uncertainties, the world’s oil expert forecasters can’t agree on whether oil demand growth will peak in the next 30 years or not. Just another indication of how uncertain is the energy picture around the world and the global economy. A major issue that is perhaps already affecting investment decisions in oil companies is the affects of new technologies for fuel efficiency and electric cars and of future carbon rules on oil consumption in the future. The Wall Street Journal published on May 22, 2017 the results of an informal survey of big oil companies and the International Energy Agency on when they expect global demand for oil to peak. BP and Exxon Mobil don’t foresee a peak in the near future, while BP thought it would peak in the 2040s, Royal Dutch Shell 2025-2030 (so soon!), Statoil 2030, Total as soon as 2040, and the IEA after 2040. In May 2016, Shell’s scenario group published a plausible scenario of the world meeting international climate goals and achieving a net-zero emissions state. Shell described a number of key developments over the next 50 years that could lead to net-zero emissions, including significant investments in solar, wind, and nuclear sources, carbon capture and storage technologies, many country de-carbonization strategies, and a global carbon pricing system—whether through carbon trading, carbon taxes, or mandated carbon-emission standards.

Even if oil demand peaks in the foreseeable future and the world achieves a net-zero emissions state, oil and natural gas will continue to be key energy sources. Shell’s scenario group in May 2016 highlighted that for the future global population of 10 billion people to have a decent quality of life, the global energy needs would have to double by the end of the century. Oil and natural gas would have to remain important energy sources for the next forty years, until solar, wind, and nuclear sources can assume the burden of meeting the global economy’s needs. If the net-zero emissions state is reached, let’s say by the end of the century, the share of oil and gas in the overall energy mix will have fallen from 57 percent to around 15 percent, while the non-fossil-fuel share would be just under 80 percent.

China is rapidly reshaping its energy supply and demand mix and its foreign trade in energy commodities.

  • US coal exports to China have recently shrunk to almost nothing. They were almost 6 million short tons in 2011, 10 million tons in 2013, and less than 1 million in 2016. Out of seven West Coast export terminals proposed in the past five years, none has opened.
  • In January 2017, Mongolia announced a new deal to sell coal to China. With Chinese coal production falling rapidly because of China-government environmental concerns, the deal effectively transfers China’s pollution to Mongolia. Trucks carrying coal are backed up for nearly 40 miles at Mongolia’s southern border with China. Observers call it the world’s largest traffic jam.
  • North Korea’s economy is heavily dependent on China’s purchase of North Korean coal and China’s supply of oil. China is essentially the only importer of North Korean coal. New UN sanctions toward North Korea because of nuclear-weapons development activities have limited North Korean coal exports to China. China has recently supported those sanctions.
  • China Petroleum & Chemical, or Sinopec, is attempting to double domestic natural gas production in the next five years by rapidly expanding natural gas production from shale reserves in order to reduce coal usage in the country and reduce China’s need for imported liquefied natural gas. Many investors around the world were counting on sending natural gas to China.

Nuclear energy plants are progressing in many parts of the world, but not in the United States and Germany. Electricity from US nuclear plants at about 1.5 mega-watt hours per year is expected to decline very slowly over the next 25 years. Toshiba’s subsidiary, Westinghouse, recently declared bankruptcy over escalating costs involving billions of dollars to finish Southern Co.’s Vogtle Electric Generating Plant, the first new nuclear plant in the United States in three decades.

The International Energy Agency (IEA) report on CO2 Emissions from Fuel Combustion highlighted that the growth in global CO2 emissions was slowing down. In 2014, the IEA indicated the global CO2 emissions were 32.4 gigatons of carbon dioxide (GtCO2), an increase of 0.8 percent over 2013 levels. The growth in 2013 over 2012 levels was 1.7 percent, while the average annual growth rate since 2000 has been 2.4 percent. Work by the Intergovernmental Panel on Climate Change (IPCC) shows that holding warming to 2°C typically requires global annual emissions to peak sharply around 2020, fall steeply by 50% before 2040, and be close to net zero towards the end of the century. The EIA’s International Energy Outlook 2016 reference case has global energy-related CO2 emissions growing about 1 percent/year from 2012 to 2040, but will CO2 emissions peak much sooner than anyone expected?

CO2 emissions aren’t the only environmental issue of coal. An immediate problem—in developing countries in particular—is particulate emissions. China’s government is actively tackling smog created by burning coal. New instructions were issued in February 2017. These may have a greater impact than previous instructions that are sometimes ignored by local authorities. The concentration of fine particles, or PM2.5, in Beijing’s air—about 65 micrograms per cubic meter in 2016—still exceeds the World Health Organization’s recommended limit of 25 micrograms per cubic meter. Beijing’s fine particulate level is getting better—it was over 100 micrograms per cubic meter in 2013, but still more than double the recommended limit.

ORACLE MUSINGS ABOUT THE FUTURE OF COAL AND CO2 EMISSIONS

Global Energy Mix. For the next 20 years, the range of uncertainty on the energy sources used in the world will remain extremely wide. The use of nuclear, the government restrictions on hydrocarbons, the technology innovations in renewables, natural gas development, and clean carbon, etc. all remain uncertain. Still it’s very plausible:

  • Nuclear power will gain more advocates and expand.
  • Oil demand will remain high because consumers in both developing and developed countries will continue to prefer internal-combustion-engine cars and trucks over alternative-fueled vehicles.
  • Renewable power will expand more rapidly than projected in non-OECD countries. For many countries, in ten years more than 50 percent of new power capacity will be from renewables sources. Major investments in infrastructure for using more renewable technologies will be made.

While the demand for oil will increase for the next 20 years, the demand for natural gas is going to explode.

  • Natural gas production could grow even more than base case scenarios because of technology innovation, a raft of new government restrictions around the world on use of coal in power generation, and high costs of clean coal technology.
  • Technology innovation will likely continue to lower the costs of shale gas development. China and Argentina will see rapid expansion in their natural gas productions.
  • The two big hurdles for companies developing the new oil and gas reserves will be the large capital required to explore, develop, and produce oil and gas in hard to reach places, and the liability risk to companies from oil spills and contributing to global warming.

Future of coal: Global coal demand could begin to fall soon.

  • The momentum to substitute natural gas for coal in electricity generation will likely accelerate.
  • Coal use will continue to decline in the United States. It’s uncertain how Trump administration policies could affect that decline, but in general the trend won’t likely reverse.
  • The biggest changes in coal usage will be in China and India. As long as natural gas prices remain low, coal demand will most likely keep falling significantly. In fact, China and India will struggle to keep up with the forces driving those declines.
  • Clean coal technologies will struggle to become commercial. Few new coal plants will be built, but retrofitting old facilities with expensive clean coal capabilities is not likely going to happen.

CO2 tipping-point. Global annual CO2 emissions may be peaking and could start to fall, perhaps even sharply, from 2020 to 2030. Momentum will increase to continue the policies that led to more efficient energy usage in the economy, the expansion of nuclear, the substitution of natural gas for coal in electricity generation, etc.

China’s Leadership on Energy and the Environment

  • China’s changing policies toward improving the country’s air quality and energy supply in the next ten years will have the greatest impact on global CO2 emissions and the world’s goal of reaching a net zero CO2 emissions state as soon as possible.
  • China will ride the wave of coal use reduction and expand its commitments toward global environmental goals. China will assume a much large leadership role on environmental issues in international forums, like the IPCC.
  • Chinese corporations will continue to invest heavily toward becoming global leaders in renewable-energy technologies, like solar electricity generation and electric cars.
  • China companies will be the industrial leaders around the world in all commodities, including oil, gas, and coal. The Chinese companies will be the biggest, invest the most money, and generally be aggressive to capture the most market share.
  • The Chinese government will likely support Chinese companies moving abroad with various means of support to help them penetrate foreign markets and avoid trade and tariff costs.
  • In general, transparency of commercial transactions between governments and commodity producers will go down worldwide; corruption levels could increase.
  • In many respects, India’s accomplishments will be greater, but they will follow China’s.

The battles over the development and use of fossil fuels could become even more intense.

  • Greenhouse gas emissions will continue to accumulate in the atmosphere and ocean for the foreseeable future. CO2 emissions from gas will continue to grow because of the growth in natural gas production.
  • NGO’s will continue to object to natural gas and oil development and production activities and the companies that conduct them.
  • Gas companies will never be viewed as good world citizens.
  • Large private oil and gas companies could experience more protests wherever they operate.
  • Russian and Chinese companies will be singled out more and more by NGOs.
  • Many western governments will find themselves simultaneously penalizing and sanctioning Russian and Chinese companies involved in oil and gas operations.

New economic system for electricity will emerge over the next 15 years: But no one can predict the dynamics of that system because there are too many uncertainties in technology, geopolitics, human behavior, climate change, energy supply sources, energy demand, and economics.

  • Major disruptions in energy supply could occur.
  • No one can predict what the costs of energy and environmental protection will be. The range of possible outcomes is very wide.
  • If CO2 emissions peak, societies will likely place a higher priority on lower costs and more robust economies than on less chance of significant climate change and higher costs.

Energy Industry and the Governments that Depend on It

  • A restructuring of the global energy industry is underway.
  • Renewable energy will be at the center of the industry, but fossil fuels will still be essential for the global economy.
  • The players will change quite a bit, and power will shift to developing-country producers, both state-owned and private ones.
  • Sovereign-wealth funds will continue to accumulate wealth and power.


Question to Oracle: Will Streaming Video Change the World?

RESPONSE

Yes. The internet has already changed how people conduct their lives. Now new video over the internet and smart phones will change those lives even more. Google’s YouTube viewers watch more than 1 billion hours a day of video. The large internet players are rapidly penetrating video/TV markets with streaming video, and live video over the internet is already being seen by hundreds of millions of users. In as little as five years, high-resolution video from space satellites could reveal much more about globe events and people. All this new information about the world will stimulate social, political, and economic change. New norms and rules for monitoring everyone’s public activities will develop. National governments everywhere will seek to control the specificity of live video. Public servants and senior corporate officials should expect the public will have access to video of their work activities. Streaming video of the world will become a very large market, and a new generation of technology companies and services will likely be born.

RECENT SIGNALS OF CHANGE:

Imagery satellites are being launched with global video capabilities.

  • The Alphabet imaging-satellite subsidiary, Terra Bella, recently acquired in early 2017 by Planet Labs is building and launching a constellation of satellites that can capture the first-ever commercial high-resolution video of Earth from a satellite.

Dramatic rise of video that’s being watched over the internet

  • Google’s YouTube’s viewers watch more than 1 billion hours a day. Total video watched on the internet rose from 5 billion hours per day in 2010 to 15 billion hours per day in 2016, while broadcast and cable television hours were level or slightly declining over the same period at around 22 billion hours per day. 400 hours of new content video is being uploaded to YouTube every minute, or 65 years of video per day. Source: The Wall Street Journal, February 28, 2017, p. B1.
  • In the United States, all age groups except those over 50 years old are watching less broadcast and cable TV every year. For all age groups, TV watching shrank almost ten percent from 2010 to 2016. Source: The Economist, October 29, 2016, p. 56.
  • Alphabet’s YouTube service is launching a new web TV streaming package of over 40 broadcast and cable channels for $35 per month. That is the same price as AT&T’s cheapest bundle. But Alphabet didn’t have to pay $49 billion to buy DirectTV like AT&T did—Alphabet’s margins must be significantly better than AT&T’s.
  • Headline of Wall Street Journal columnist, Christopher Mims, on February 8, 2017: “How Millennials Are Turning Snapchat Into the New TV.” Snapchat video clips are never longer than 10 seconds, but they can be strung together into “stories” that can be several minutes. Sims suggests that for Snapchat users watching these stories is a lean-back experience like watching TV. Snapchat in February reported its users view 10 billion videos (not longer than 10 seconds) a day.

Live video over the internet is capturing hundreds of millions of users.

  • In January 2016 GoPro teamed with Twitter-owned Periscope to allow users to broadcast live from their GoPro devices connected to iPhones. Users have the ability to switch instantly between the GoPro and the iPhone’s video camera—i.e., each user can do two-camera live action shots.
  • Live video is the current big battleground for Facebook, Snapchat, Twitter/Periscope, YouTube, and many smaller startups. China has 200 live-streaming platforms. In September 2016, ii-Media Research predicted there would be over 300 million viewers of live streaming in China, or about half of China’s internet users, by the end of 2016. Source: “Cash Flows in China Live Streams,” The Wall Street Journal, 9/28/16, p. B6. Until recently TV and cable broadcasters exclusively broadcast live video. Live new media video is totally disrupting the traditional media industry.
  • In December 2016 China issued new regulations requiring foreigners to submit a formal application with the Ministry of Culture before they can post live-streaming videos from their smartphones and websites.
  • In November 2016 The Wall Street Journal reported Amazon has been talking to major sports organizations like the National Basketball Association, Major League Baseball, and the National Football League about providing streaming live sports.

Smart phones are becoming the future platform for almost everything.

  • Four of the top five smart phone vendors in China in 2016 were Chinese. The top three companies (Oppo, Huawei, and Vivo) grew significantly in 2016 compared to 2015, with Oppo’s and Huawei’s shipments almost reaching 80 million units. Apple was No. 4 in the market and its shipments shrank in 2016 compared to 2015. No. 5 Xiaomi’s shipments also shrank. Source: The Wall Street Journal, March 18, 2017, p. B3.
  • Samsung’s new Galaxy S8 smartphone that will be on retail shelves in late April 2017 will have a larger and better screen than all its major competitors and can also serve as a desktop computer.

Advertisers are rushing to online, digital ads, creating major opportunities for those platforms able to attract the most users’ time. Online, digital ad spending is beginning to approach TV ad spending.

  • Digital ad spending is rapidly catching up and could soon be greater than TV ad spending. Global ad spending in 2017 is expected to be ~ $180 billion (33 percent of the total) in digital, online media and ~$220 billion (40 percent of the total) for TV. This compares to global ad spending in 2010 of ~$66 billion (16 percent of total) for digital, online media and ~$181 billion (or 44 percent of total) for TV ad spending.
  • An article in The Wall Street Journal on February 1, 2017 titled “Facebook’s Steep Wager on Online Video Has to Pay Off” noted Facebook’s revenue in 2016 is expected to increase 46 percent from the year before, but that this growth is going to “come down meaningfully” in 2017. The article indicated Facebook is betting on video, including Facebook Live, to play a much bigger role in the future. CEO Zuckerberg has apparently said he envisions the company becoming a “video-first” company.
  • The advertising world is struggling with this major shift from traditional advertising platforms, such as print and TV, to digital. In early March 2017, the world’s largest advertising firm, WPP PLC, reported its slowest quarter of growth since 2012 of only 2% this year. Magna Global, the adbuying agency owned by Interpublic Group of Cos project global ad expenditures will grow 3.6 percent in 2017 compared to a higher 5.7 percent growth in 2016.

Large internet video players are paying more and more for unique, high-quality content

  • The tech companies with streaming capabilities like Netflix, Amazon, and Hulu are developing strong content production capabilities. Source: The Economist, August 20, 2016.
  • In early March 2017, Facebook was reported interested in funding or contracting for original TV-like programming. The focus wasn’t on live content. This pivot in paying probably large amounts of money for content is a big change for the company.
  • Online businesses are buying traditional media assets. In December 2015, Alibaba Group, China’s e-commerce giant, bought the South China Morning Post and all other media assets from the SCMP Group. Alibaba’s digital strength will enable the 112-year-old newspaper to become a global media entity covering China for readers around the world. While the Hearst Corporation’s Cosmopolitan magazine just announced it is teaming up with Snapchat to launch the Cosmo “channel” on Snapchat’s “Discover” newsstand.

All major corporations now have major digital media presences.

  • For most corporations, new digital media has become an important new channel of corporate communications, marketing, and selling the company’s products and services to millions of customers and potential customers. For many corporations—particularly new, high-tech ones—it’s the primary channel. A new book published in 2016, “Super-Consumers,” by Eddie Yoon of Cambridge University describes the importance and influence of the group representing ten percent of consumers that accounts for 30-70 percent of sales and almost 100 percent of “customer insights.” This high-passion group is defined by both its sales size and its attitude to the product. Facebook and Google are focused on developing strong relationships with their super-fans.

PLAUSIBLE DEVELOPMENTS WE COULD SEE IN THE FUTURE

High-quality video content will likely engage billions of smart phone users in the next ten years and likely shape world behavior.

Streaming video will make the world smaller.

  • People around the world will have substantially greater access to video of local, national, and global events and places through their smart phones.
  • The volume of live video generated by smart phones will continue to increase rapidly.
  • Live video from space satellites with the resolution to distinguish a person from a car could be available in as little as five years.
  • The demand for high-quality video content to engage billions of smart phone users will grow.
  • The need for tools to curate video content quickly will increase.

Live streaming video will be a very large market

  • Live high-quality content like sports could be particularly valuable.
  • Breaking news and live coverage of global events could become very valuable.
  • New live video apps focused on global events like armed conflicts, natural disasters, seasonal migrations, etc. will grow.
  • New sporting events that use large geographic areas and can be covered live could develop: ocean sailing, cross-country races, county hide-and-go-seek competitions, etc.

Increased video information of individuals and the activities of commercial and government organizations around the world will be available

  • Surveillance and monitoring of everyone in public will increase.
  • Demand for full coverage of work activities of elected officials and employees of government organizations, particularly of police, fire, emergency response, and maybe even schools will increase.
  • There could be growing demand for information about the lives of senior executives to be made publicly available.

New regulations and tools:

  • Governments at all levels will likely develop policies for the capturing and dissemination of video of people, companies, and government organizations.
  • New restrictions on how video information can be accessed, transmitted, and used will likely vary significantly around the world from tighter restrictions to fewer restrictions.
  • Authoritarian governments could go to extremes to limit access to the new video, particularly video emanating from foreign sources.
  • Public opinion will likely vary significantly within each country, and from country to country, on how open and transparent the internet should be and what personal information, particularly about government officials and senior corporate executives, should be private and what protections should be provided.
  • Online media companies that search for, gather, store, or transmit personal data could implement new policies to protect an individual’s personal information on video and minimize the ability of third parties to use video information with individuals that can be identified in them.
  • New tools and technologies for protecting an individual’s video information online or identifying an individual online may develop.

Business Winners

  • With their current global market positions in social media and internet services, US firms could benefit significantly from the growth of streaming video.
  • A new breed of firms—the next Snapchat—will emerge focused on video experiences.
  • Traditional news organizations will need to figure out a way to provide unique high-quality live video or better analysis of breaking events to remain in business.
  • Global social-media campaigns using video may influence governments to discriminate against multinationals they can’t control because of their national origin (e.g., Chinese companies in the United States) more than they do today. Could China treat German companies different from US companies?
  • International operations of Chinese and Russian multinationals involved in capturing, disseminating, and storing streaming video will likely be monitored, controlled closely, and possibly severely limited by governments.
  • Most advertising monies will likely be spent in online advertising and the most important consumer groups will be spending the majority of their time online. If they already haven’t, companies that sell consumer products or services will need to focus on digital marketing and the use of the internet.
  • The massive amounts of video data about events and responses could enable people or organizations to become more effective in predicting or purposely triggering desired surge responses.

Corporate affairs

  • New media campaigns may become much more effective.
  • New public affairs capabilities—reaction time (time to get in front of an issue), crisis management, managing the information flow, use of new media tools, participation of more employees in social media responses, monitoring of employees’ social media and online activity, use of live video will likely be required
  • New corporate policies about employee behavior outside the workplace or online may be needed, even if only to reaffirm no restriction.
  • New corporate policies may be required for executives’ social media postings.


Question to Oracle: Will Populist Media Campaigns toward Corporations Be a Major Threat?

ORACLE RESPONSE:

Yes. New media campaigns are starting to shape consumer-purchase and business-policy decisions of corporations. This new media is enabling blitzkrieg communications, including fake news, to the public by individuals, social groups, and political groups about the political, social, or economic attitudes of corporations or their senior executives. Those blitzkrieg communications about corporations and their products and services are likely going to increase and become more effective in the speed, targeting, and messaging. In the future a company’s identity, business reputation, and brand could be heavily influenced by the demographics, attitudes, and beliefs of company’s employees, particularly the senior executives. It’s very uncertain, how big populist attacks are going to become for corporations, particularly consumer-product/service companies, and it’s uncertain what can or will be done to protect a corporation’s identity and business activities from those attacks. But it’s critical for corporations to have a business policy for how it addresses political, social, and economic issues, whether and how it communicates about those issues, and how it will manage blitzkrieg campaigns against them.

RECENT SIGNALS OF CHANGE

New media is changing how people conduct their lives, including how they participate in their communities and the political process and how they make choices about the products they buy and services they use. Everyone now has endless opportunities to say something or act in some way. Each act provides the individual a feeling of satisfaction or pleasure, while the cost or risk to the individual feels small, unless you’re in China where the goal is to register every individual act and keep a tally. The influence of the new media is getting bigger and bigger.

  • Advertisers rushing to online, digital ads. Online, digital ad spending is beginning to approach TV ad spending. Newspapers are really suffering.
    • Digital ad spending is rapidly catching up and could soon be greater than TV ad spending. Global ad spending in 2017 is expected to be ~ $180 billion (33 percent of the total) in digital, online media and ~$220 billion (40 percent of the total) for TV. This compares to global ad spending in 2010 of ~$66 billion (16 percent of total) for digital, online media and ~$181 billion (or 44 percent of total) for TV ad spending.
    • An article in The Wall Street Journal on February 1, 2017 titled “Facebook’s Steep Wager on Online Video Has to Pay Off” noted Facebook’s revenue in 2016 is expected to increase 46 percent from the year before, but that this growth is going to “come down meaningfully” in 2017. The article indicated Facebook is betting on video, including Facebook Live, to play a much bigger role in the future. CEO Zuckerberg has apparently said he envisions the company becoming a “video-first” company.
  • Rise of live video
    • In January 2016 GoPro teamed with Twitter-owned Periscope to allow users to broadcast live from their GoPro devices connected to iPhones. Users have the ability to switch instantly between the GoPro and the iPhone’s video camera—i.e., each user can do two-camera live action shots.
    • Live video is the current big battleground for Facebook, Snapchat, Twitter/Periscope, YouTube, and many smaller startups. China has 200 live-streaming platforms. In September 2016, ii-Media Research predicted there would be over 300 million viewers of live streaming in China, or about half of China’s internet users, by the end of 2016. Source: “Cash Flows in China Live Streams,” The Wall Street Journal, 9/28/16, p. B6. Until recently TV and cable broadcasters exclusively broadcast live video. Live new media video is totally disrupting the traditional media industry.
    • In December 2016 China issued new regulations requiring foreigners to submit a formal application with the Ministry of Culture before they can post live-streaming videos from their smartphones and websites.
    • Another WSJ article on February 6, 2017 about the content of Snapchat’s registration filing for its initial public offering was titled “How Millennials Are Turning Snapchat Into the New TV.” Snapchat noted in the registration that its users view 10 billion videos a day.
    • In November 2016 The Wall Street Journal reported Amazon has been talking to major sports organizations like the National Basketball Association, Major League Baseball, and the National Football League about providing streaming live sports.
    • Online businesses are buying traditional media assets. High-quality content online will likely differentiate new media companies. In December 2015, Alibaba Group, China’s e-commerce giant, bought the South China Morning Post and all other media assets from the SCMP Group. Alibaba’s digital strength will enable the 112-year-old newspaper to become a global media entity covering China for readers around the world. While the Hearst Corporation’s Cosmopolitan magazine just announced it is teaming up with Snapchat to launch the Cosmo “channel” on Snapchat’s “Discover” newsstand.

Two big brothers: New Media Superstars and Government. An individual’s private life and work life are increasingly inseparable and increasingly visible to everyone, while at the same time governments and corporations are gathering more and more digital data everyone, including a lot of information about how individuals behave in a wide variety of circumstances.

  • Big data enabled computational politics. In December 2015, a database containing the records of 191 million US voters found its way onto the internet. Politicians and government agencies could target individuals with personalized messages. But this is not just happening in the United States. In Britain, the Conservative Party used targeted ads on Facebook to help win the general election in 2015.
  • Hangzhou’s local government is piloting a “social credit” system the Communist Party wants to roll out nationwide by 2020. The aim of the national social credit system is to “allow the trustworthy to roam everywhere under heaven while making it hard for the discredited to take a single step.” The plan for the system is to compile digital records of citizens’ social and financial behaviors to calculate a personal rating that will determine what services they are entitled to, and what blacklists they go on. A person can incur black marks for infractions such as fare cheating, jaywalking, and violating family-planning rules. The Economist notes “The scale of the data-collection effort suggests that the long-term aim is to keep track of the transactions made, websites visited and messages sent by all of China’s 700m internet users.” The Economist, “Creating a digital totalitarian state: Big data gives Chinese rulers new ways to monitor and control citizens,” December 17, 2016, p 21.
  • For most corporations, new digital media has become an important new channel of corporate communications, marketing, and selling the company’s products and services to millions of customers and potential customers. For many corporations—particularly new, high-tech ones—it’s the primary channel. A new book published in 2016, “Super-Consumers,” by Eddie Yoon of Cambridge University describes the importance and influence of the group representing ten percent of consumers that accounts for 30-70 percent of sales and almost 100 percent of “customer insights.” This high-passion group is defined by both its sales size and its attitude to the product. Facebook and Google are focused on developing strong relationships with their super-fans.
  • In a special report in The Economist, September 17, 2106, entitled “The rise of the superstars” Adrian Wooldridge described how high-tech companies become superstars by discovering niche markets and then scaling up as fast as possible. This “blitzscaling” is required to develop the necessary millions of customers to earn any money and prevent potential competitors from reaching those customers first. The article points out a downside of the emergence of superstars with global scale, namely the negative feelings they generate in the general population toward big business. One reason is a customer’s perception of being at the mercy of one company. Another is the emergence of superstars and the consolidation of industries result in unique, large relationships between the superstars and government. And because of those connections to government, the government policy preferences of superstars and the political connections of their business leaders are news information.

Social and political dynamics. Digital media communications is today’s means for creating political or social action.

  • ISIS might not exist without the internet and social media.
  • We are now experiencing chaotic pluralism where mobilizations spring from the bottom up, often reacting to events. Thousands of events are occurring each day, most of which don’t result in surge responses.
  • Collective action based on online postings leaves a big digital footprint. Governments can use this information to monitor protests and intervene when they feel it’s necessary. They can also identify and do something about the online activist leaders.
  • Most governments, particularly those with authoritarian regimes and some resources—like Russia and China—are investing heavily in web-based propaganda. These include social-media bots and other spamming tools to drown out real online discussions and “trolls” to act on their behalf in Western comment sections, Twitter feeds, etc. China authorities have an extensive censor system for blocking any comments or online postings.
  • A study at the University of Konstanz found that the internet tends to grow fast in countries in which the governments are concerned about the flow of information, but there is no evidence so far “that democracy advances in autocracies that expand the internet.”
  • It was reported in early February that Facebook and Google have active programs in Europe to combat “fake news”—the rapid spread of online misinformation—in upcoming important elections in France and Germany.

New Media Actions toward Corporations. An important new development is that opponents of a corporation’s business policy, its industry, its products or services, or even the politics or social positions of key executives are starting use this same new media infrastructure against the corporation. And given the potential speed, intensity, and potential impacts of the new media actions, this is critical business policy for every corporation to address and plan for.

  • The Trump election result stimulated a number of business boycott and support actions. A group called Grab Your Wallet identified after the election a number of stores that shopper should boycott during the Christmas holiday. Trump supporters are using Twitter to encourage consumers #buytrump or #buyivanka or asking people to boycott Starbucks stores because Starbucks Corp. pledged to hire 10,000 refugees. The success or failure of the various actions will be closely analyzed for lessons learned. The first analysis of Grab Your Wallet’s campaign indicated it had little impact on the targeted merchants’ sales.
  • In January 2107, Uber fell behind its much-smaller competitor Lyft in the Apple App Store after Uber app users deleted their accounts largely in protest over Uber CEO Travis Kalanick’s ties to President Trump. Kalanick then resigned from Trump’s business advisory council in the first week of February.
  • The CEO of Under Armour was criticized recently for remarks made in a television interview where he said he respected President Trump’s willingness to make bold decisions and said, “To have such a pro-business president is something that is a real asset for the country.” Some groups called for boycotts of Under Armour products and a financial analyst covering Under Armour’s stock downgraded his rating for the stock to “negative” from “neutral” saying “We believe the decision to express a view in today’s highly charged political climate was a mistake.” A week later the CEO announced he would publicly fight President Trump’s proposed travel ban, trying to mitigate the damage of his earlier comments.
  • President Donald Trump praised Boeing Co. on February 17, 2017 in a visit to a Boeing manufacturing plant in South Carolina. He also said, “This is our mantra. Buy American and hire American.” Boeing CEO has met a number of times with following Mr. Trump’s initial blast on Twitter in December 2016 against the cost of the new jets it will build to serve as Air Force One and threatening to even cancel the plan.


PLAUSIBLE DEVELOPMENTS WE MIGHT SEE IN THE FUTURE

New-media actions could be a major threat for corporations. At a minimum, corporations need to consider the range of possible campaigns they could face and develop plans for how they monitor new media activities and how they would respond to a major surge action affecting them.

More powerful new media actions likely in the future:

  • Larger online user bases will enable testing of thousands of models about the behavior of online social networks, including the movement of misinformation or fake news online.
  • The massive amounts of data about events and responses could enable people or organizations to become very effective in predicting or purposely triggering desired surge responses. In other words, new media campaigns may become much more effective.
  • More and more will be targeted at corporations.

Less privacy for corporate employees:

  • More information will be available online about each individual’s personal and work lives. A lot of that online information will be restricted, but an increasing amount will publicly accessible.
  • Government agencies, corporations, activist groups and the general public will likely increasingly seek personal information about employees of large corporations.

Nationalism and multinationals:

  • Most corporations are already readily identified with their original home country and not seen as independent of geopolitics. Those country-to-company alignments could become catalysts even more for new-media actions.
  • A multinational’s identity may become even more aligned with their home country’s policies and behavior, despite protests to the contrary.
  • Social campaigns on new media may influence foreign governments to discriminate more than they do today against multinationals based on nationality. Will China treat German companies different from US companies?
  • Issues for new media could be the locations of the company’s headquarters, political views of company executives, nationalities of work force, geographic footprint of the multinational, environmental footprint, etc.

New online rules and tools:

  • European efforts to help individuals to be forgotten may stimulate efforts around the world for individuals to be able to manage what information about them is available online.
  • Online media companies that search for, gather, store, or transmit personal data could implement new policies to protect an individual’s personal information online, minimize the ability of third parties to publicize personal information about an individual, and provide individuals the means for controlling what personal information is shown, including perhaps the ability to hide information already online.
  • Public opinion will likely vary significantly within each country, and from country to country, on how open and transparent the internet should be and what personal information, particularly about senior corporate executives, should be private and what protections should be provided.
  • Governments will likely impose new restrictions on how personal information can be accessed, transmitted, and used. Those restrictions could likely vary significantly around the world from tighter restrictions to fewer restrictions.
  • New tools and technologies for protecting an individual’s online personal information online or identifying an individual online may develop.
  • Applications may develop for the Dark web so an individual’s online personal activities remain hidden.

For companies that sell consumer products or services:

  • They could experience significant new media actions based political, social, or work activities of their senior executives.
  • An executive’s social and political identity could increasingly be a factor in corporate brand strength and reputation and vulnerability to populist action.
  • With the heightened publicity, discrimination lawsuits by individuals often employees against corporations may increase over issues of employee nationality, religion, language, hiring of foreign legal residents, etc.

Corporate affairs, identity, and brand management:

  • Corporations large and small and not just consumer companies will most likely need new business policies, marketing strategies, and corporate affairs capabilities for navigating a business environment where customers and users overnight can be turned off or on in response to new media surges, stimulated by external events or outside agents, friend and foe.
  • New corporate affairs capabilities—reaction time (time to get in front of an issue), crisis management, managing the information flow, use of new media tools, participation of more employees in social media responses, monitoring of employees’ social media and online activity, use of live video will likely be required
  • Managing the risks and opportunities from new-media actions will require corporations to spend more resources on corporate affairs, identity, and brand management.
  • Corporations may need to develop a new business policy with regard to corporate positions on social and political issues and how corporations should participate in political or social processes related to those issues. Should corporations attempt to remain neutral on social and political issues because of the risks, participate more strongly on social and political issues, or what.
  • New corporate policies about employee behavior outside the workplace or online may be needed, even if only to reaffirm no restriction.
  • New corporate policies may be required for executives’ social media postings.
  • Executives could be required to sign morals clauses with their employers—like pro athletes, entertainers, and newscasters do now—to help protect their employer in the event the executive engages in reprehensible behavior or conduct that may negatively impact his or her public image and, by association, the public image of the corporation.
  • We might also see reverse morals clauses where executives protect their personal reputations against actions or behavior of an employer that negatively impacts the executive’s public image.